Sign Up
Filters
2
Projects
People
Srikanth Tangirala
Mumbai, India
Data Analyst / Data Scientist
11
Followers
Follow
Message
0
International Debt Statistics Analysis
0
30
0
Sentiment Analysis of Google Playstore App Reviews
0
34
0
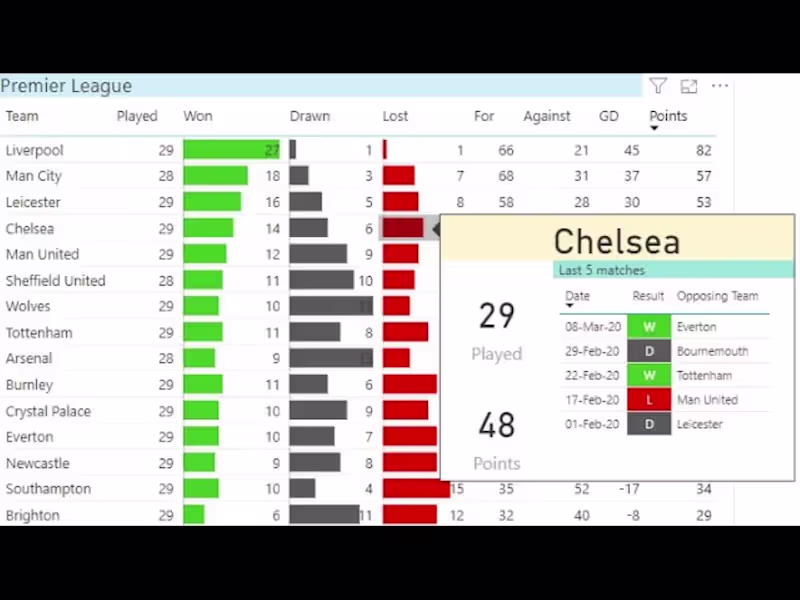
English Premier League Table
0
14
View more →
Jupyter
(2)
Follow
Message
TechAPeek Services
Mumbai, India
🔍 Transforming Data into Business Insights
Follow
Message
0
Dynamic Advertisement Overlay
0
6
0
Billing Management System
0
4
0
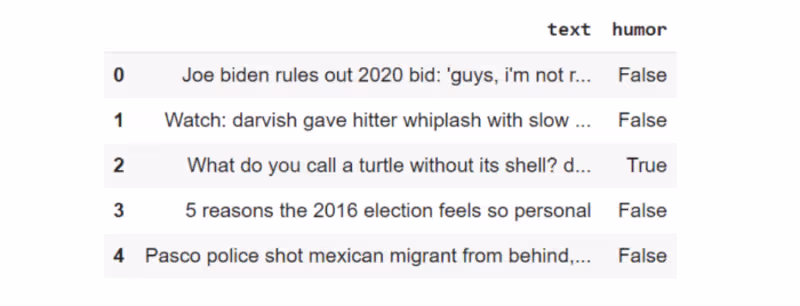
HUMOUR DETECTION USING NLP
0
68
View more →
Jupyter
(1)
Follow
Message
Aniket More
Mumbai, India
Data Science/Analysis, Excel, Python, Power Bi, Scikit learn
New to Contra
Follow
Message
1
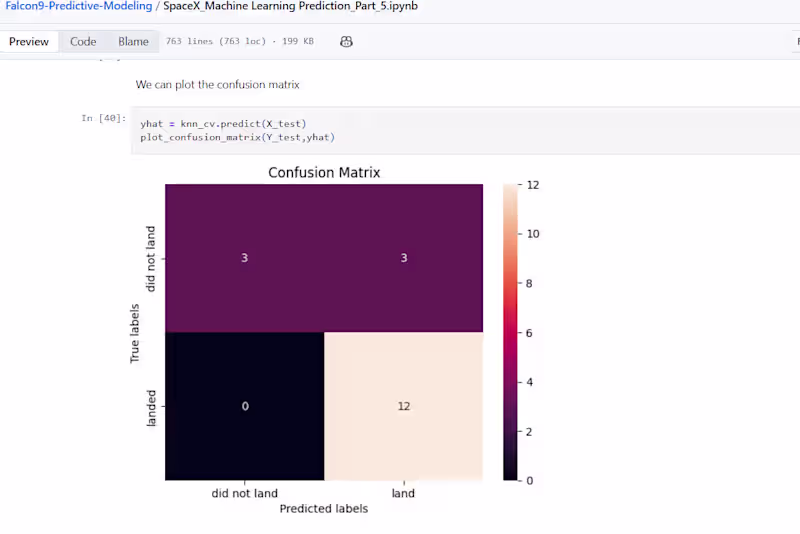
Here is the Capstone project I have got hands on experience on while completing professional certification course. It web Scrapes data from web for falcon rockets and builds a predictive model using machine learning algorithm using scikit learn model
1
36
0
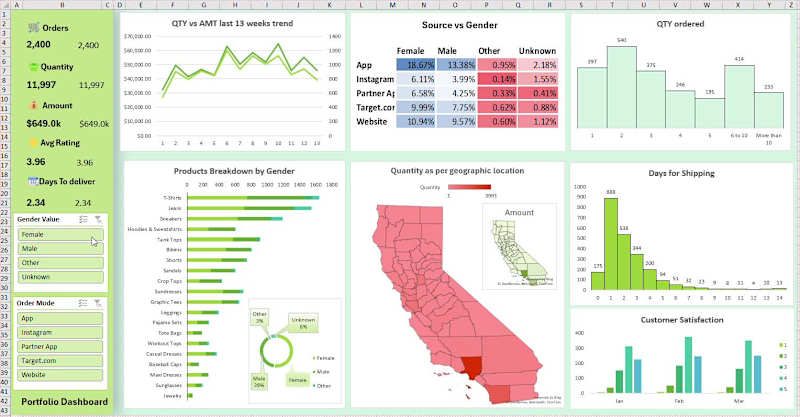
Hello All, Below is a sample Dashboard for a sales data prepared using excel. It uses data visualizations in excel and interactive slicers to modify the visuals.
0
14
1
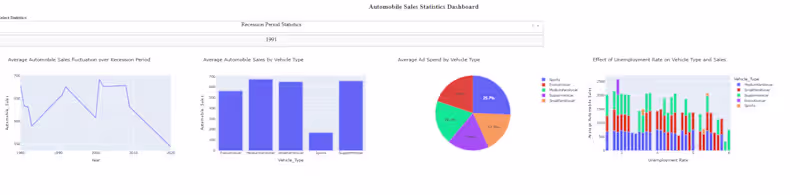
Below is an interactive web based dashboard, using Python pandas, plotly dash. The graphs are interactive and gets updated automatically using the drop down provided.
1
53
1
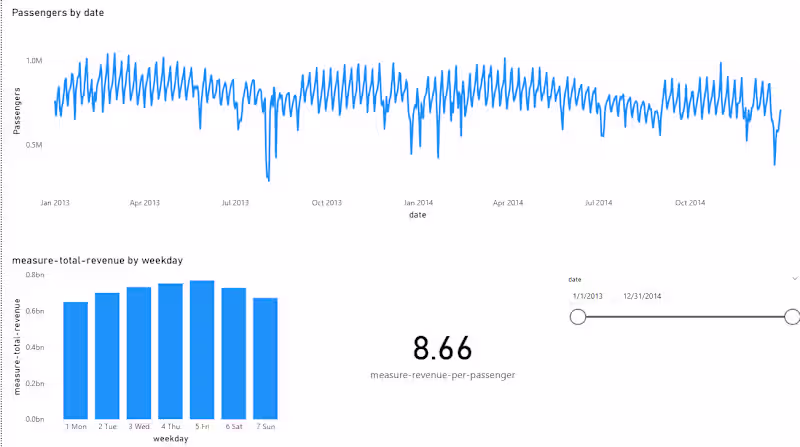
This is a practice project I worked on to exclusive on power bi to make a simple dashboard to have an interactive visual, with date sliders. With metrics like revenue per passengers, and passenger by date
1
44
Jupyter
(1)
Follow
Message
Explore people