Data Visualization Projects in Meerut
Data Visualization Projects in Meerut
Sign Up
Post a job
Sign Up
Log In
Filters
2
Projects
People
Message
0
Aastha Kansal
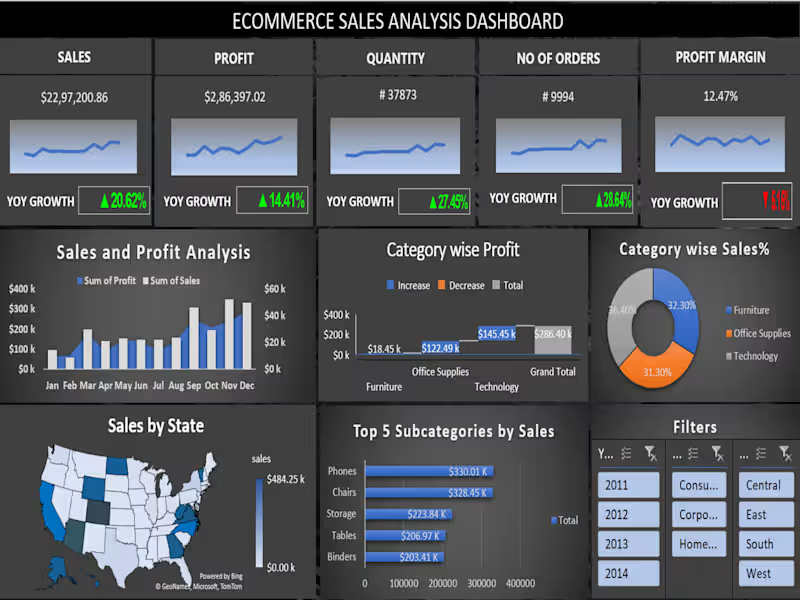
E-Commerce Sales Dashboard Development
0
7
Message
0
Ajay Arora
Customer Insights Analysis
0
31
Message
0
Anmol Kapoor
DATA ANALYSIS: Insights On Electric Vehicles Launch In India
0
13
Message
0
Kushwaha Dhamsingh
Data Visualizations for Sales Reports
0
12
Message
0
Aastha Kansal
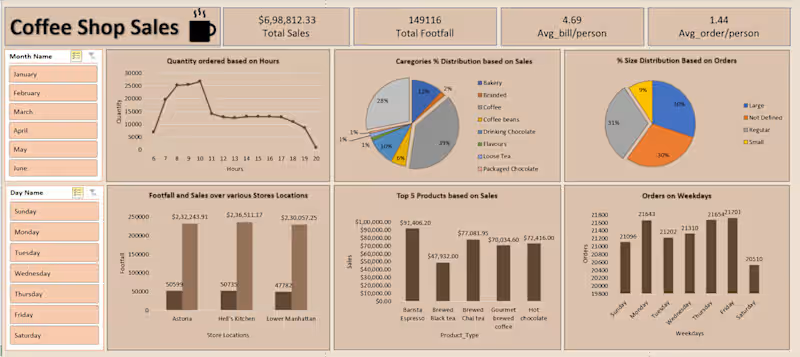
Built an interactive sales dashboard using Microsoft Excel to analyze revenue, customer footfall, and product performance. 📊 Key Highlights: • Total Sales: $698K+ • Peak Hours: 8–10 AM • Coffee contributes 39% of revenue • Friday has highest orders 🛠 Tools Used: ●Pivot Tables ●KPI Cards ● Slicers ●Data Visualization
0
69
Message
2
Aastha Kansal
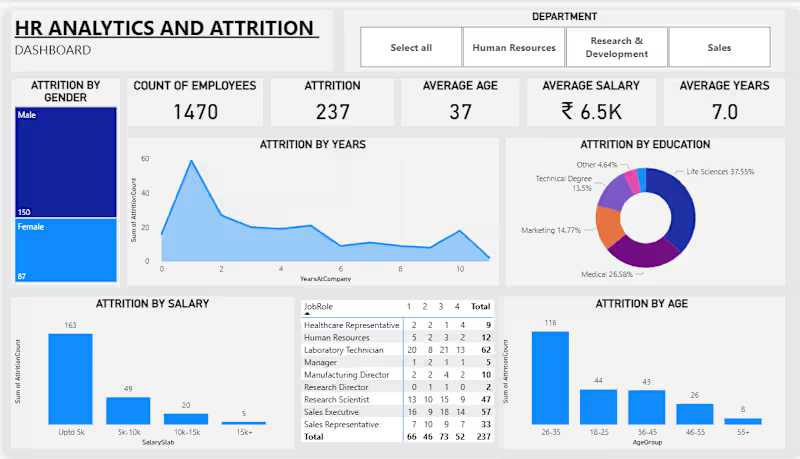
Developed an interactive HR Analytics & Attrition Dashboard in Power BI to analyze employee attrition and workforce trends. Analyzed 1,470 employee records across age groups, salary levels, and departments, using KPI cards, charts, filters, and DAX to deliver actionable workforce insights.
2
297
Message
2
Aastha Kansal
E-Commerce Sales Analysis Dashboard — Excel
2
226
Explore projects