
B2B SaaS Product Designer for AI & Complex Workflows
- 21
- Followers
B2B SaaS Product Designer for AI & Complex Workflows


Boost Profits with Detailed Finance Analysis 💼
Boost Profits with Detailed Finance Analysis 💼


View more →

Finance & compliance partner for growing small businesses.
New to Contra
Finance & compliance partner for growing small businesses.

I Built a profit-and-loss bridge tracing FY29 revenue down through each cost layer (raw material, direct expenses, employee costs, admin costs) to EBITDA. The waterfall view makes it immediately clear which cost categories are compressing margin the most, rather than the client having to infer it from a flat P&L table.😊
0
74

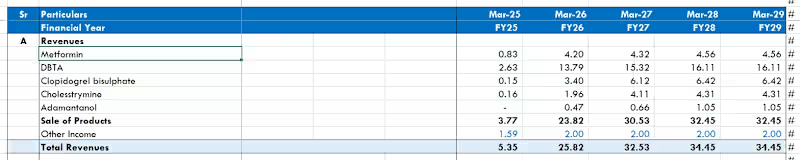
I Built a product-level revenue model from scratch for a pharma manufacturing client, projecting FY25–FY29. Revenue is derived bottom-up from unit volumes and pricing across 5 product lines rather than a single blended growth assumption, capturing staggered product launches and realistic ramp-up curves. Total revenue grows ~6.4x over the period, from ₹5.4L to ₹34.4L.
0
27
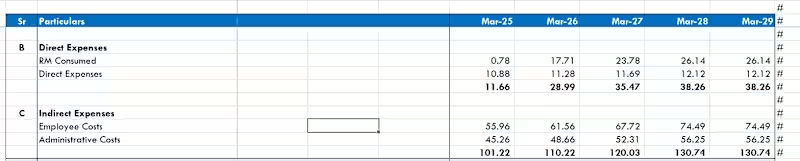
Broke down the client's full cost base into raw material, direct expenses, employee costs, and admin costs for FY29, rather than leaving overheads as one lump "operating expenses" line. Employee costs (43%) and admin costs (33%) turned out to be the largest levers — visibility the client didn't have before, since these were previously buried in a single total.
0
23

Data Analyst | SQL • Python • Excel • Power BI • Tableau
Data Analyst | SQL • Python • Excel • Power BI • Tableau
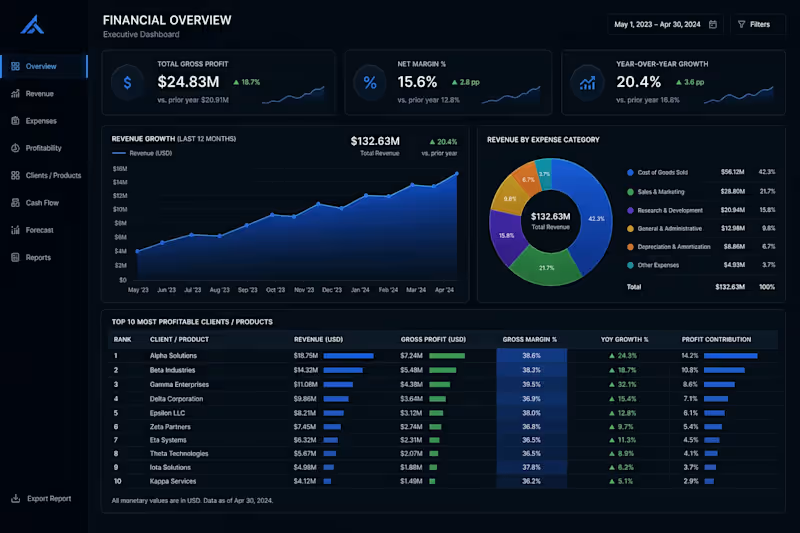
This Project Involved The Development Of A Comprehensive Financial Intelligence Suite Designed To Monitor Corporate Fiscal Health And Strategic Growth Metrics. Utilizing A Unified Data Model Engineered Through Complex SQL Aggregations, The System Integrates Disparate Transactional Streams Into A High-Fidelity Executive Dashboard. The Analysis Focuses On Critical Performance Indicators Including Total Gross Profit ($24.83M), Net Margins (15.6%), And Year-Over-Year (YoY) Revenue Trends. By Implementing Dynamic Profit Contribution Models And Expense Categorization, The Project Provides Stakeholders With Granular Visibility Into Net Profitability Across The Entire Client Portfolio, Facilitating Data-Driven Resource Allocation And Identifying A 20.4% Sustained Growth Trajectory.
1
87
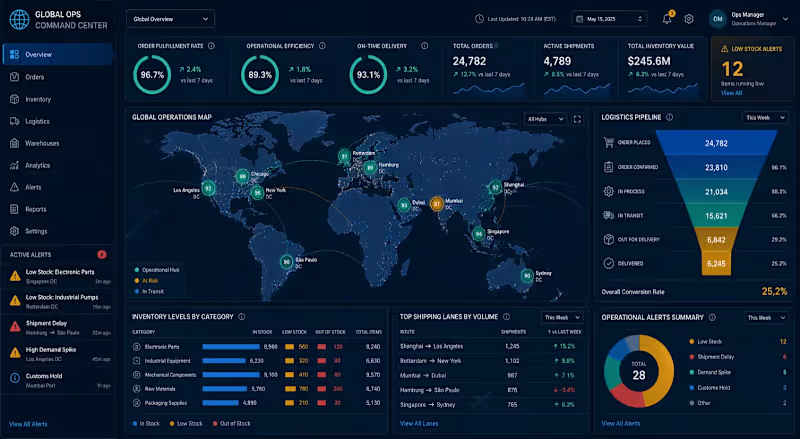
This Project Focused On The Architecture Of A Dynamic Operational Command Center Designed To Optimize Global Supply Chain Logistics And Inventory Management. By Integrating Multi-Source Data Streams Using Advanced SQL Querying, The System Provides Real-Time Visibility Into Key Performance Indicators Such As Order Fulfillment Latency, Inventory Turnover Ratios, And Regional Delivery Success Rates. Utilizing Sophisticated Data Visualization Techniques, The Dashboard Empowers Stakeholders To Identify Logistics Bottlenecks And Streamline Warehouse Operations. The Implementation Of Automated Trend Analysis Facilitated A Significant Reduction In Stock-Out Incidents And Enhanced Overall Operational Efficiency By Providing Granular Insights Into The End-To-End Supply Chain Lifecycle.
1
88
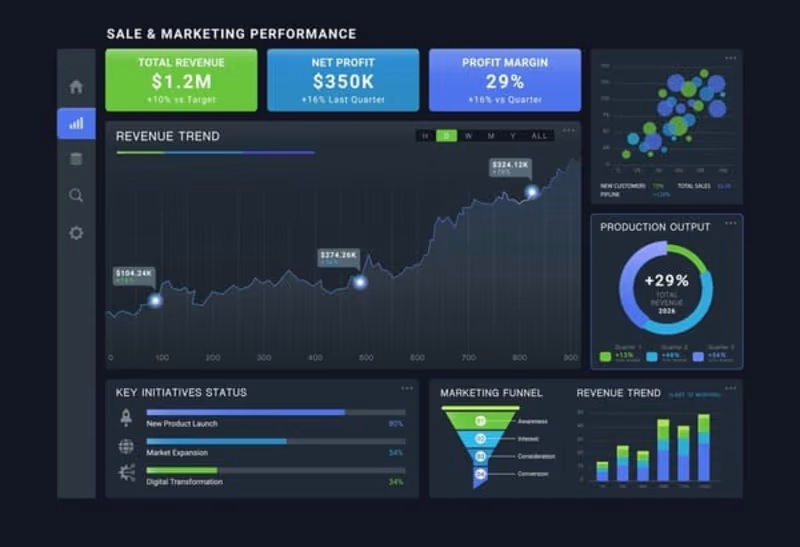
"I Designed A Comprehensive Sales Performance Dashboard To Track Key Business Metrics Across Multiple Regions. By Integrating Raw Data Into A Dynamic Visual Interface, I Provided Leadership With Real-Time Insights Into Profit Margins, Regional Growth, And Product Performance, Enabling Data-Driven Strategy Decisions That Optimized Inventory Allocation."
1
107
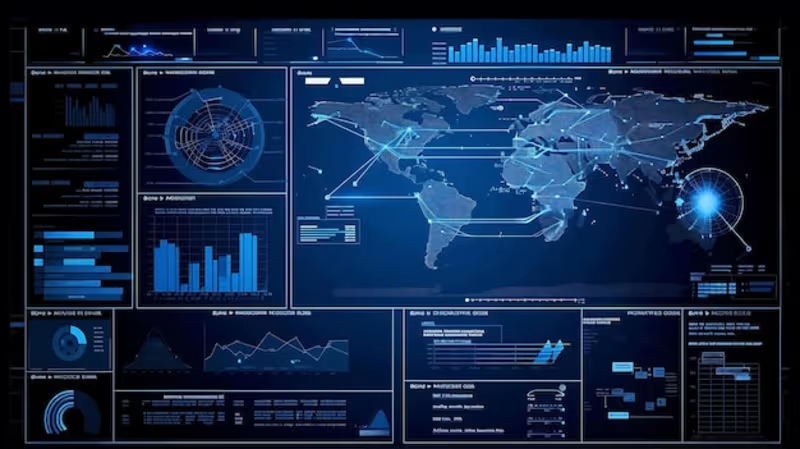
"I Developed A SQL-Driven Monitoring System For A Global Supply Chain Network. By Writing Complex Queries To Analyze Inventory Levels Across Multiple International Warehouses, I Created An Automated Flagging System For Low-Stock Items. This Project Demonstrates My Ability To Handle Large-Scale Relational Databases And Provide Actionable Logistics Insights."
1
120

Expert UX Designer in B2B and B2C Spaces
Expert UX Designer in B2B and B2C Spaces

View more →

Quality Financial Analyst & Advisor
Quality Financial Analyst & Advisor

View more →

Scaling Teams, Optimizing Costs, Driving Growth
Scaling Teams, Optimizing Costs, Driving Growth

View more →