
SAP MM/WM & Power BI Specialist | Inventory & Supply Chain
New to Contra
SAP MM/WM & Power BI Specialist | Inventory & Supply Chain
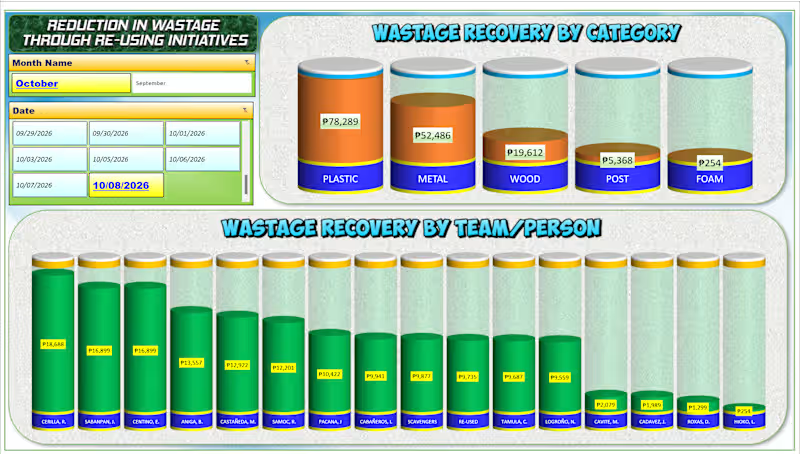
📊 Turning Data into Insights with Excel! 📊
I recently built this dynamic "Wastage Recovery Tracker" dashboard to help teams easily monitor costs, analyze categories, and track performance in real-time.
Good data analysis isn't just about the numbers—it's about making them clear, actionable, and visually engaging.
📩 Need a custom dashboard or data analysis design like this for your business? PM me directly, and let’s discuss how we can bring your data to life!
#DataAnalysis (https://www.linkedin.com/search/results/all/?keywords=%23dataanalysis&origin=HASH_TAG_FROM_FEED) #ExcelDashboard (https://www.linkedin.com/search/results/all/?keywords=%23exceldashboard&origin=HASH_TAG_FROM_FEED) #DataVisualization (https://www.linkedin.com/search/results/all/?keywords=%23datavisualization&origin=HASH_TAG_FROM_FEED) #ExcelTips (https://www.linkedin.com/search/results/all/?keywords=%23exceltips&origin=HASH_TAG_FROM_FEED) #BusinessIntelligence (https://www.linkedin.com/search/results/all/?keywords=%23businessintelligence&origin=HASH_TAG_FROM_FEED) #FreelanceDataAnalyst (https://www.linkedin.com/search/results/all/?keywords=%23freelancedataanalyst&origin=HASH_TAG_FROM_FEED)
0
75
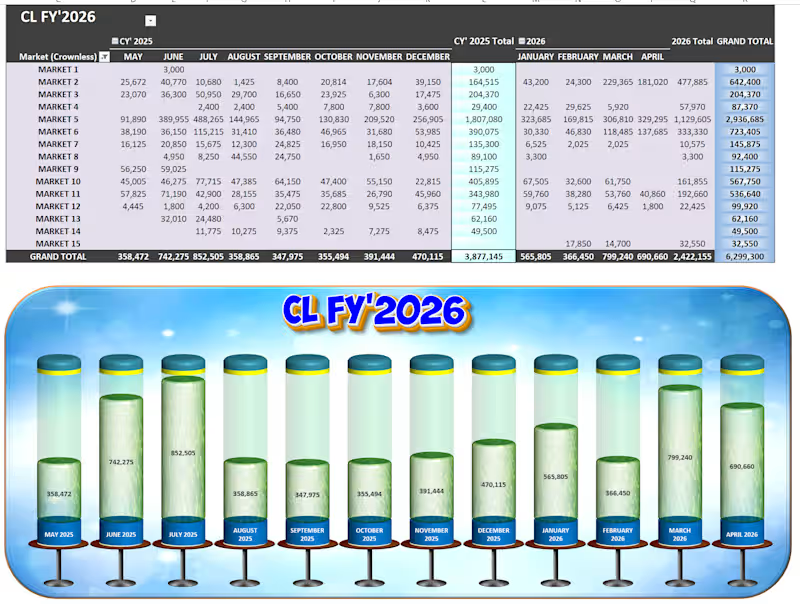
🚀 Project Spotlight: Upgrading Excel to an Executive Web-App UI 📊✨
Most corporate reporting falls into two traps: it is either a dense, unreadable wall of numbers, or a pretty graphic that has to be manually redrawn every single week.
I built this CL FY'2026 Market Performance Tracker to prove that you can achieve automated, heavy-duty backend engineering AND an immersive, software-like user experience entirely within native systems.
Here is the exact 3-tier workflow behind this build:
⚙️ Tier 1: The Automated Pipeline (Power Query)
No manual data entry. No copy-pasting. Raw transactional data is fed directly into Power Query, which acts as the automated data-cleaning engine. With a single click, the query automatically shapes, cleans, and runs ETL processes on thousands of rolling rows, refreshing the dashboard in seconds.
📊 Tier 2: The Core Logic Matrix (Dynamic Pivot Table & 3D Chart)
• The Grid: The transformed data consolidates seamlessly into a multi-period Pivot Table, mapping 15 distinct regional markets across an active 12-month calendar. It handles everything effortlessly, highlighting Market 5 as our heavy hitter with 2,936,685 in total volume.
• The Volumetric Display: The lower chart panel isn't a stagnant graphic—it is a live, native 3D Pivot Chart configured into cylinder metrics. As new numbers hit the backend table, the liquid fill-levels automatically rise or drop in real time to show progress against a 6,299,300 Grand Total.
🎨 Tier 3: The Premium UI Skin (Photopea Enhancement)
To lift the dashboard completely out of the standard "spreadsheet look," I engineered a high-fidelity background framework inside Photopea. Dropping the functional, live Excel components into this polished visual skin provides an immersive app environment, clean visual hierarchy, and polished title framing without compromising a single cell of live functionality.
The Takeaway: Spreadsheets don't have to be boring to be powerful. By treating data architecture like a product, you give clients and executive teams instant clarity at a single glance.
🛠️ Built with: Microsoft Excel (Power Query, Pivot Tables, 3D Charting) & Photopea (UI Layout Design).
0
88
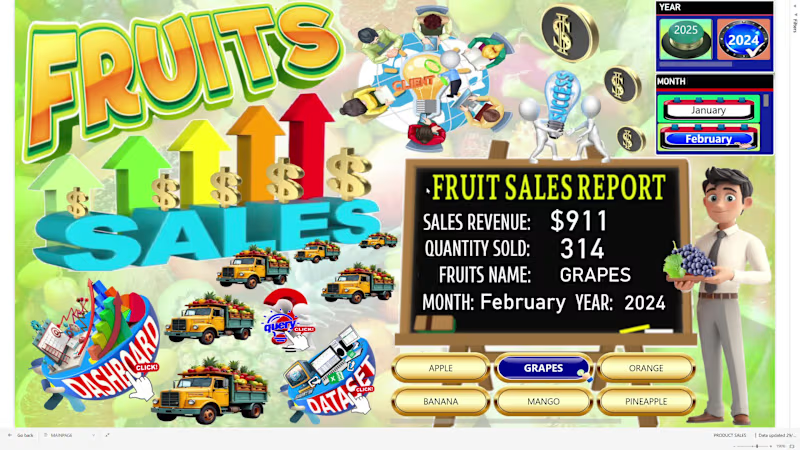
### 🍍 Fruit Sales Data Analysis – Interactive Power BI Dashboard
An interactive Power BI dashboard designed to analyze fruit sales performance and provide clear graphical insights into revenue, sales volume, product, size, and geographic performance.
The dashboard includes:
Sales Revenue – total revenue generated from fruit sales
Total Sales Quantity – total quantity of fruits sold
Sales by Fruit Name – compares sales performance across different fruits
Sales by Size – analyzes sales across different fruit sizes
Sales by City – identifies sales performance by city
Sales by Country – compares sales across countries
Sales per Month – monitors monthly sales performance
Revenue per Month – tracks monthly revenue trends
Sales Trend by Fruit – analyzes monthly sales trends by fruit name
Geographic Sales Analysis – identifies locations with the highest and lowest sales performance
The interactive dashboard allows users to explore product, size, time, and geographic sales patterns, helping identify top-performing fruits and markets while supporting data-driven sales and business decisions.
Key value:
Sales data → KPI analysis → Product & size analysis → Geographic analysis → Monthly trends → Graphical insights → Business decisions
0
107
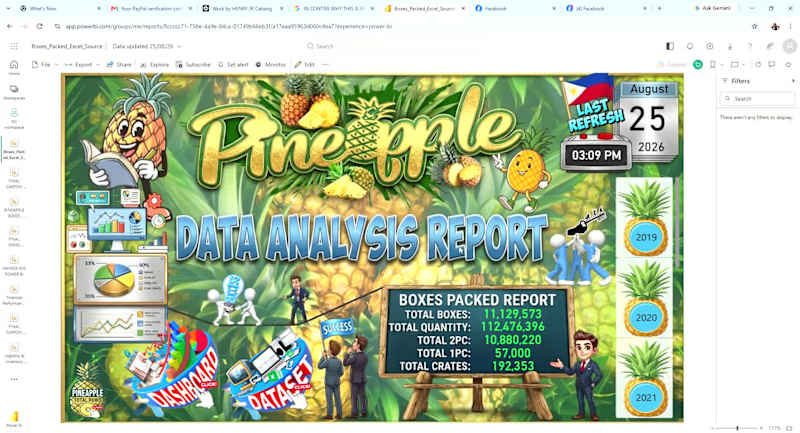
An interactive Power BI dashboard designed to monitor pineapple production and packing performance from 2019 to the present year.
The dashboard provides graphical insights into:
Total Pineapple Boxes Packed – overall production/packing volume
Daily, Weekly, Monthly, and Yearly KPIs – performance monitoring across different time periods
Packing Trends – identifies production trends and changes over time
Brand Distribution – boxes packed by brand
Tag Distribution – analysis of packing tags
Variant Distribution – comparison of different pineapple variants
Pack Size Distribution – analysis of boxes packed by pack size
Time-Based Analysis – allows users to drill into daily, weekly, monthly, and yearly performance
The dashboard helps management quickly understand packing volume, production trends, and product mix, while identifying changes in brand, tag, variant, and pack-size distribution.
Key value:
Production data → KPI analysis → Trend analysis → Product mix → Graphical insights → Better operational decisions
0
81


Quick & Accurate Thumbnails & Data Entry Expert
Quick & Accurate Thumbnails & Data Entry Expert


View more →