

Design and Development Partner For Startups (A.I Powered)


Design and Development Partner For Startups (A.I Powered)

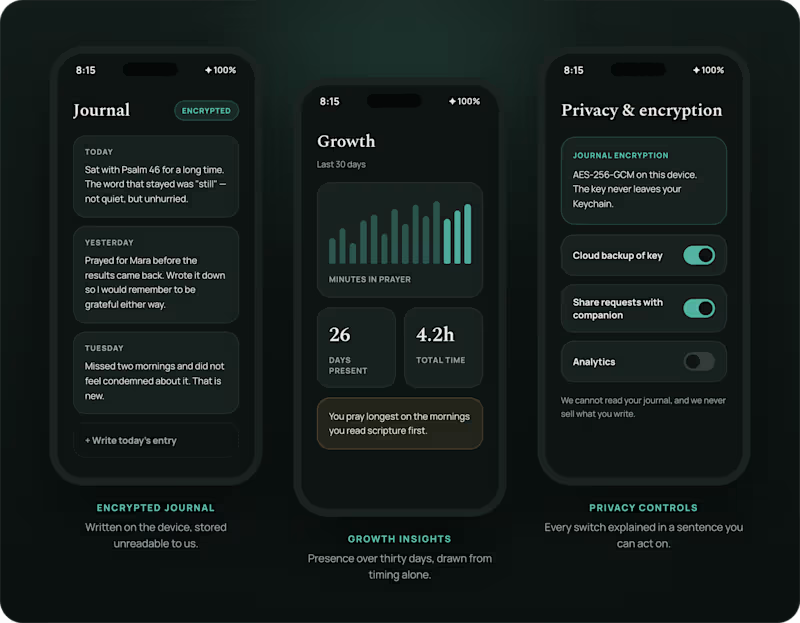
A prayer app that measures presence, not streaks.
Prayer Guide is a free daily-prayer companion: scripture, guided prayers, a focus timer, an encrypted journal, and people to pray with. Designed end to end and shipped to both stores.
Role: Product design & build
Platform: iOS & Android
The problem
Habit apps borrow their mechanics from fitness tracking: streaks, badges, notifications that escalate when you slip. Applied to prayer, those mechanics turn a practice into a performance, and a missed day into guilt.
The other failure is privacy. People write their most vulnerable thoughts into a journal, and most apps store that text in plain sight.
The approach
Slow the interface down. One verse and one guided prayer a day, a timer that counts breaths rather than reps, and no red badge for a day you missed. Every feature is free, so nothing sits behind a paywall when someone needs it.
The journal encrypts on the device before it syncs. Prayer requests stay readable only so they can be shared with a chosen companion.
Outcome
Live on both stores, free, with a thousand people praying daily
https://prayerguide.thedigitalninjatech.com/
1
87




FRONTEND DEVELOPER, UI UX & FRAMER DESIGNER
FRONTEND DEVELOPER, UI UX & FRAMER DESIGNER

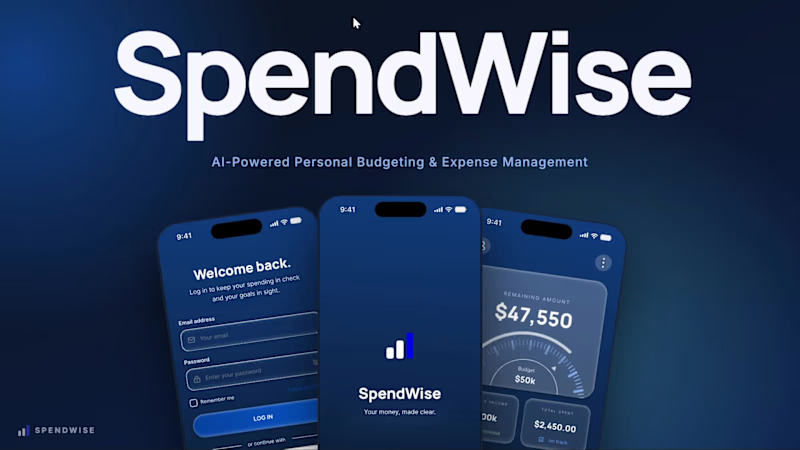
Let’s Talk About Spending Your Money Wisely 💸
Introducing SPENDWISE, a personal finance app concept I’ve been working on.
Spendwise is an AI-powered budgeting app designed to help individuals manage their budgets, understand where their money goes, and make smarter decisions about how to allocate what’s left.
The idea is simple: budgeting shouldn’t just tell you what you’ve spent. It should help you understand your spending and make better decisions about what comes next.
I also created a short 30-second motion video using Claude to bring the concept to life and make the idea easier to visualize, full concept would be dropped soon.
Sometimes, a little motion makes a product idea easier to understand.
What do you think about having AI help you decide where your money should go next?
1
52

I’ve been thinking about AI image generator apps lately…
Not just what they produce, but how they feel to use.
So I designed a simple concept focused on:
– easy prompt input
– guided style options
– smooth generation flow
– clean results gallery
Simple experience → more creativity.
If you’re building something in this space, I’d love to connect.
1
1
108

Anime-Space is a cinematic, immersive discovery platform designed for anime enthusiasts. It features a "Weekly Spotlight" carousel that showcases top-tier series with high-quality background trailers, interactive detail reveals, and curated download links, all wrapped in a sleek, professional interface.
0
83

UI/UX Designer designing websites and apps that converts

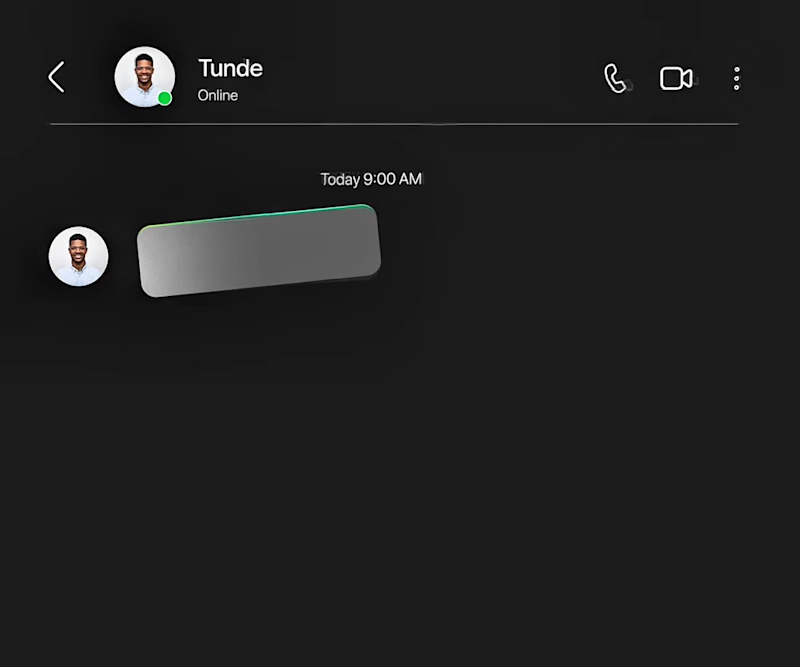
Created this indrive Ads using Figma motion.
Here’s the storyline: most people complain of high prices of ride, so I offered indrive as the solution.
with indrive, book your ride and agree on a comfortable price with your driver.
So basically, the problem is high ride prices and the solution is Indrive.
Good motion design is meant to identify the problem and offer a solution.
Started the design with the storyboard made up of up to 7 scenes and animated it.
What is good motion design to you?
2
3
95
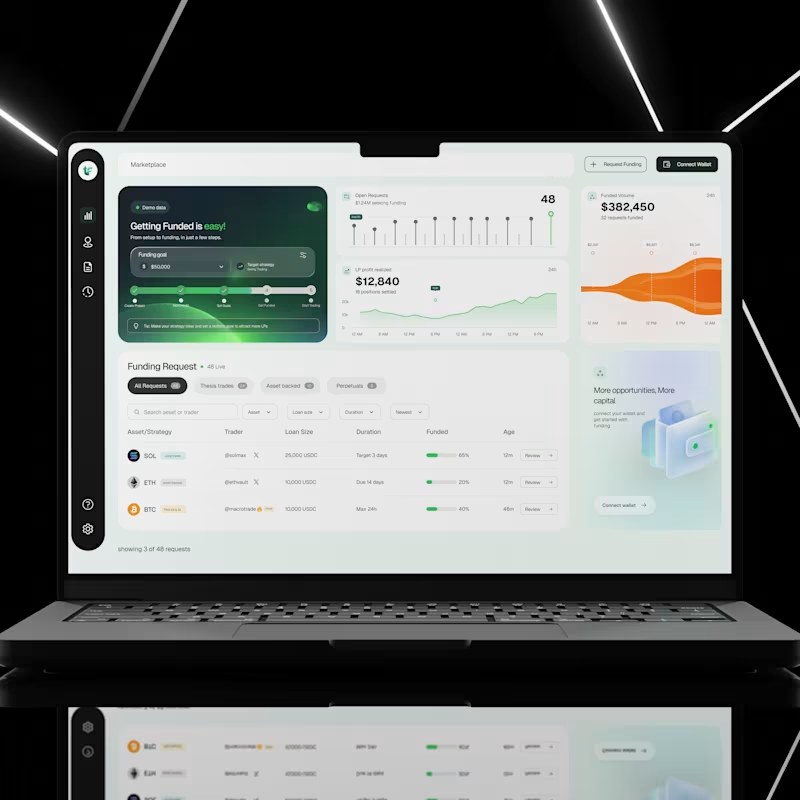
I designed a crypto funding dashboard that helps users explore funding requests, track market activity, and understand important financial information from one place.
Crypto platforms can be difficult to use, especially when users have to deal with numbers, charts, different assets, and funding options all at once.
My goal was to create an interface that makes these activities easier to understand, keeps important information within reach, and helps users find what they need without feeling overwhelmed.
The Challenge
Financial dashboards often contain too much information on one screen. When charts, numbers, filters, and tables are not properly organised, users can struggle to find important details or understand what is happening.
I wanted to solve this by creating a dashboard that feels clean, organised, and easy to navigate, even when displaying a lot of information.
My Design Approach
1. A clear overview of important information
I designed dashboard cards to show key figures, including open funding requests, funded volume, and realised liquidity provider (LP) profit.
This allows users to quickly understand what is happening without having to search through multiple pages.
2. A visual way to understand data
Instead of presenting financial information as numbers alone, I used charts and graphs to help users see changes and patterns over time.
The goal was to make complex information easier to understand at a glance.
3. An organised funding request section
I created a dedicated section where users can explore different funding requests.
Requests are grouped into categories, with search, filters, and sorting options to help users narrow down the information they need.
The table also displays important details such as the asset, trader, loan size, duration, funding progress, and request age.
This makes it easier to compare opportunities without opening every request individually.
4. A simple navigation system
I used a sidebar to keep the main navigation accessible and organised.
This helps users move between different sections of the platform without cluttering the main workspace.
5. Clear calls to action
Actions such as Request Funding, Connect Wallet, and Review are easy to find.
I wanted users to understand what they could do next without having to guess where to click.
6. A consistent visual design
I combined a clean layout, generous spacing, rounded cards, and a restrained colour palette to create a modern interface.
Green highlights important financial indicators and progress, while the darker sidebar creates a clear visual separation between navigation and the main dashboard.
The UX Thinking Behind the Design
For me, good dashboard design is not just about making numbers look attractive.
It is about helping people understand information, find what they need, and take action with less effort.
Every section of this interface has a purpose. The overview provides a quick summary, the charts help users understand activity, and the funding table makes it easier to explore individual requests.
The goal was simple: turn a screen full of financial information into an experience that feels clear, organised, and easy to use.
Key UX Principles Applied
Visual hierarchy: Important information stands out first.
Information architecture: Related information is grouped together logically.
Data visualisation: Charts make financial activity easier to understand.
Efficient navigation: Users can access key sections quickly.
Consistency: Reusable components create a predictable experience.
Usability: Search, filters, and clear actions help users complete tasks more easily.
This project is a reminder that a good user interface does more than look good. It helps people understand what they are seeing and what they can do with that information.
As a UI/UX designer, I focus on finding the balance between visual appeal, useful functionality, and a smooth user experience.
Have a dashboard or financial product that needs a better user experience? Let's work together.
1
2
85

Brand & Social Media Designer
Brand & Social Media Designer


