Full Stack Development Projects in KarachiFull Stack Development Projects in KarachiFrom Instinct to Infrastructure: How Athliq Went From Trainer's Notebook to Production Performance Platform
──────────────────────────────────────────
The Person Who Understood the Problem Before Anyone Else Did
Marcus had been a strength and conditioning coach for eleven years. He'd worked with professional football squads, Olympic track athletes, and NCAA programs. He knew exactly what was wrong with how performance data was managed, not because someone told him, but because he'd lived inside the problem every day.
Every morning, he'd open four browser tabs, a spreadsheet, and a WhatsApp thread just to answer one question: Is this athlete safe to train today?
HRV from one app. Sleep data from another. Yesterday's load from a Google Sheet. Wellness check-ins in a form nobody filled out consistently. Injury notes in a physio's personal folder. The picture was always incomplete, not because the data didn't exist, but because no system was designed to assemble it.
He wasn't guessing the problem. He was the problem's daily victim.
So he built something.
──────────────────────────────────────────
The First Version Had Real Value
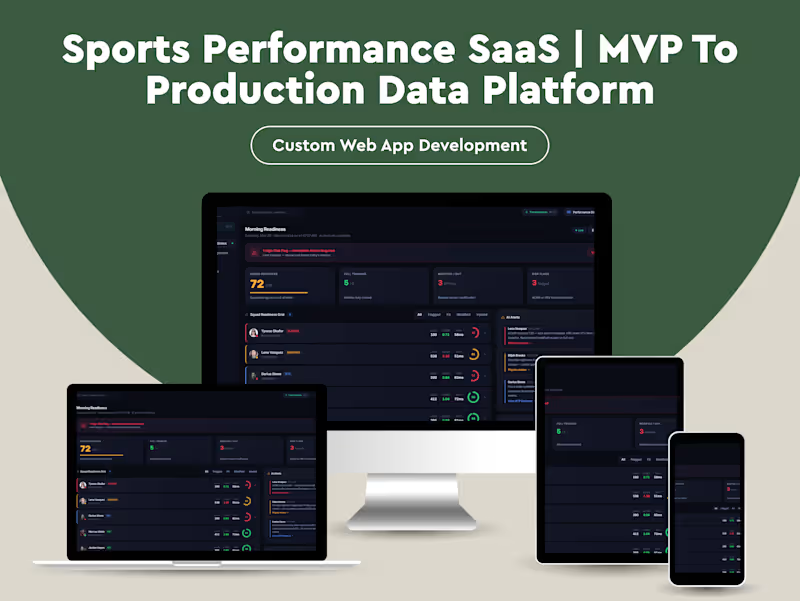
What Marcus and a developer friend put together in six weeks was genuinely useful. A React frontend. Static JSON files simulating the data feeds he wished he had. A morning readiness dashboard showing each athlete's status: green, amber, red. ACWR calculations. A training plan view. A return-to-play protocol tracker.
It looked like a real platform. It felt like one. When he demoed it to his performance director, the response was immediate: "This is what we've been trying to build for two years."
The prototype surfaced something important. The problem wasn't that nobody had the data. The problem was nobody had designed the right lens to look at it through. Marcus had. His system organized information around the questions coaches actually ask, not the questions software vendors assume they ask.
The initial build worked. For one squad. In static conditions. With fake data.
And that was exactly the point where it started to matter, and exactly the point where its limitations became unavoidable.
──────────────────────────────────────────
What Started Breaking
The prototype had no backend. Data was hardcoded. Every "insight" was pre-written. The readiness scores didn't calculate; they were authored. When a second sport scientist saw the demo and said, "Can we plug in our GPS data?" there was no honest answer that didn't involve a complete rebuild.
More specifically:
The data layer was decorative. The JSON files looked real but required manual authoring for every scenario. There was no pipeline, no ingestion, no validation. Any live deployment would mean the dashboard showed stale or fabricated numbers, which in a performance context is worse than showing nothing at all.
The AI insights were static strings. Every "AI-generated" recommendation was hardcoded text. In the prototype, this was fine. It demonstrated the concept. In production, it would mean the same insight appearing for every athlete regardless of their actual state, silently eroding clinician trust.
The system had no concept of time. Training load calculations, ACWR ratios, wellness trends, all of these are temporal by definition. The prototype rendered them as snapshots. A real system needed rolling windows, historical comparison, and the ability to detect change over time.
There was no role isolation. The role switcher in the UI was cosmetic. A physio and a performance director seeing the same underlying data with a CSS class change was not access control, it was theater.
Nothing would survive a real integration. Real wearables return messy, incomplete, delayed data. The system had no error handling, no retry logic, no fallback states. The first real data feed would have broken the UI in ways that were invisible until they were catastrophic.
The system was not wrong. It was early.
──────────────────────────────────────────
Why They Didn't Just Fix It Themselves
Marcus understood sport science. His developer understood React. Neither of them had built a production data system before, and that gap is not a skills deficiency, it is a domain specialization.
What they needed was not someone to rewrite their frontend. The frontend was actually good. The visual hierarchy was sharp, the domain terminology was accurate, the workflows reflected how coaches genuinely think. That institutional knowledge was irreplaceable and not to be discarded.
What they needed was:
• A real-time data layer that could ingest from multiple sources reliably
• A calculation engine that could run ACWR, load zone distributions, and readiness scoring against live data
• A structured API contract between the front and back end
• Authentication and role-based data scoping that actually enforced access boundaries
• Observability, so when something silently broke, someone would know
The prototype had proven the concept. The job now was to make the concept dependable.
──────────────────────────────────────────
What We Actually Did
We kept the frontend. Almost entirely. The visual design, the component architecture, the domain-accurate terminology, all of it stayed. We refactored the data layer, not the UI layer. The prototype's greatest strength was its UX fidelity to how coaches actually work, and we had no interest in rebuilding that from scratch.
We built a real data ingestion pipeline. Rather than static JSON, we designed a service layer that could ingest from GPS units, HRV monitors, and wellness form submissions. Each source had its own adapter with validation, normalization, and error handling. Partial data was acceptable; silently wrong data was not.
We replaced static calculations with a live computation engine. ACWR calculations now ran against a rolling 28-day window of actual load data. Readiness scoring pulled from real HRV baselines, not fixed numbers, and recalibrated as an athlete's personal baseline shifted over a training block.
We replaced pre-written AI insights with a rules-based inference layer. Every insight shown in the platform now corresponded to a condition that was evaluated against live data. If Lena Vasquez's ACWR crossed 1.3 and her HRV dropped more than 15% from her 7-day baseline, the injury risk flag was triggered, not because it was hardcoded, but because those conditions were true.
We implemented real role-based access control. A physio sees medical data, injury history, and RTP protocols. A sport scientist sees load analytics and benchmarks. A performance director sees the squad-level overview. A head coach sees readiness and today's session. The frontend already had role-switching built in, we gave it actual enforcement.
We added observability throughout. Every data ingestion event was logged. Every calculation that produced an out-of-range result generated an alert. If a data source stopped sending, the system surfaced a staleness warning rather than silently displaying old numbers as current.
──────────────────────────────────────────
Tech Stack
React 19 + Vite, Tailwind CSS v3, Recharts, React Router v7, Node.js + Fastify, PostgreSQL + TimescaleDB, Redis, GPS/HRV/sleep data adapters (Catapult, Polar, Garmin), Google Forms/Typeform ingestion, Auth0, row-level security, Sentry, Datadog, Railway/Render, Vercel, Supabase Storage
What Changed
The morning workflow Marcus had been running across four tabs and a spreadsheet now ran in a single view that was populated automatically before he arrived at the training ground.
The difference wasn't just convenience. It was confidence.
When the dashboard flagged an athlete as high-risk, the coaching staff could interrogate why and trust the answer. When a return-to-play progression showed 80% completion, that number reflected actual criteria met against measured data, not a manually updated percentage.
The platform was no longer a demo tool. It was a clinical decision-support system.
For the squads using it, the shift was measurable: fewer reactive injury responses, more consistent load monitoring, and perhaps most importantly, a shared language between coaching staff, physios, and sport scientists built around the same data rather than competing interpretations of separate sources.
──────────────────────────────────────────
The Part That Rarely Gets Said
Most platforms built in this space start from the software side. Someone builds a data collection tool, adds a dashboard, and then tries to reverse-engineer what coaches actually care about.
Athliq started from the other direction. A domain expert who understood the problem at a professional level built the frame first, and built it correctly. The pain points were real, the workflows were accurate, the terminology was precise.
The engineering work didn't fix a bad idea. It made a good idea survivable.
That distinction matters more than most technical case studies acknowledge. The hardest part of building a platform like this is not the infrastructure. It's knowing which questions to answer. That knowledge was already there.
Our job was to make sure the system could keep answering them reliably, at scale, over time.
──────────────────────────────────────────
Athliq is now in active deployment across two professional squads and one university performance program. The morning readiness dashboard processes real-time data from four integrated sources and serves role-scoped views to performance directors, sport scientists, physiotherapists, and athletes. GreenLawn: Next-Gen Service Marketplace Built with React Native & AI 🌿
Overview:
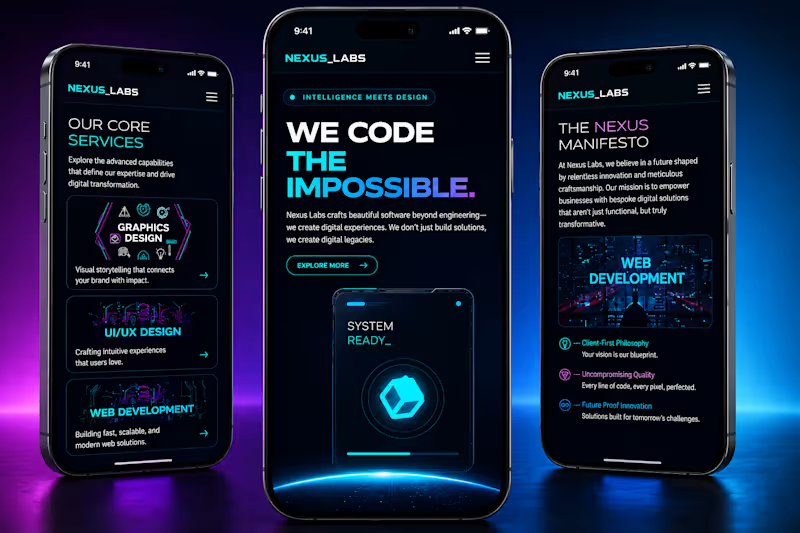
I built GreenLawn to solve a real-world problem: making lawn care services seamless, secure, and smart. Instead of spending weeks on standard boilerplate, I utilized an AI-assisted "Vibe Coding" workflow. This allowed me to focus purely on business logic, a premium user experience, and rapid deployment without compromising on quality.
The Deliverables & Features:
Smart Scheduling & GPS: Real-time service mapping for users and providers.
Secure Transactions: Fully integrated with Stripe Connect for automated, secure split payments.
AI Customer Support: Embedded "Leafy," a custom AI chatbot, to handle instant user queries.
Tech Stack (Skills used):
React Native (Mobile Development)
Stripe Connect (Payment Gateway)
AI Integrations (Chatbot / LLMs)
UI/UX Implementation
The Process (Why it matters for my clients):
By leveraging AI as a co-pilot, I cut down development time significantly. This workflow proves that building a production-ready, feature-heavy marketplace doesn't have to take months. It’s about building smarter, shipping faster, and keeping the code clean. Vanguard & Sterling LLP - Ultra-Luxury Corporate Litigation Web Platform & Executive Portal
Role & Services
Role: Lead Full-Stack Web Architect & Product Designer
Services: Custom WordPress Development, Full-Stack Architecture, UI/UX Design System, LegalTech Engineering, Cloud DevOps (Docker & Railway)
Project Overview
Vanguard & Sterling LLP is an elite corporate defense and appellate litigation practice operating in high-stakes venues, including the Delaware Court of Chancery and the U.S. Federal Courts.
The objective was to transcend conventional corporate legal websites by creating an ultra-luxury sovereign web presence coupled with an authenticated Executive Portal Enclave. The platform provides clients, general counsels, and senior partners with real-time court docket synchronization, conflict-of-interest clearance screening, an FRCP 26(b)(3) privileged document vault, and an ABA Model Rule 1.15-compliant IOLTA fiduciary trust ledger.
The Challenge
Generic Industry Norms: Traditional law firm websites feel sterile, outdated, and template-driven, failing to project the prestige and authority required for multi-billion-dollar corporate disputes.
Dual-Sided Architecture: The platform needed to serve two distinct audiences: prospective Fortune 500 corporate clients seeking counsel, and authenticated enterprise clients/partners accessing privileged litigation work product.
Complex Compliance & Data Handling: Legal-grade compliance demands: strict ABA Model Rules 1.6 (Confidentiality), 1.7–1.10 (Conflicts of Interest), and 1.15 (Trust Accounting) workflows with segregated access controls.
The Solution & Deliverables
Bespoke Sovereign Design System Visual Aesthetic: Tailored obsidian dark mode palette (#060A14, #0A1224), brushed champagne and royal gold accents (#B89552, #DFC080), and polished marble glassmorphism (backdrop-filter: blur(16px)).
Institutional Typography: Classical stone-carved judicial serif (Cinzel) paired with contemporary structural sans-serif (Plus Jakarta Sans) and editorial body type (Cormorant Garamond). Interactive Micro-Interactions: Real-time ticker feeds, responsive chamber locator maps across Wilmington, Washington D.C., New York, and London, and zero-flicker glass modals.
Executive Portal & Sovereign CMS Modules Engineered an administrative control suite natively inside WordPress without relying on bloated third-party plugins:
Certified Litigation Dockets (vg_matter): Chronological procedural histories with PACER docket numbers, presiding judge assignments, and hearing schedules.
IOLTA Trust Ledger & Statements (vg_invoice): Complete fiduciary trust accounting engine tracking escrow balances, monthly legal fee drawdowns, itemized hours/disbursements, and instant PDF generation.
Conflict Clearance Desk (vg_conflict): Real-time conflict checking mechanism with SLA response countdowns, adverse party tracking, and ethical wall sequestration directives.
Privileged Document Vault (vg_vault_doc): Work-product classification system featuring SHA-256 cryptographic digests, audit logs, and encrypted access gates.
3. Custom In-Dashboard Dossier Experience
Built an in-dashboard dossier view (vanguard-portal-view) that eliminates public website headers and footers during administrative reviews while preserving the full WordPress CMS sidebar and top bar.
Custom architectural twilight rendering on wp-login.php with frosted glass container cards and glowing focus states.
Tech Stack & Tools
Core Engine: WordPress (Custom Theme & MU-Plugin Architecture), PHP 8.2
Frontend: Semantic HTML5, Vanilla Modern CSS3, JavaScript (ES6+), SVG Vector Engineering
Database & Hosting: MySQL, Docker Containerization, Railway Cloud Infrastructure
Design & Assets: Custom Design System, Architectural Renderings, Font Interactivity (Google Fonts) I created this project as a personal portfolio experience that feels sharp, technical and credible without relying on generic futuristic visuals.
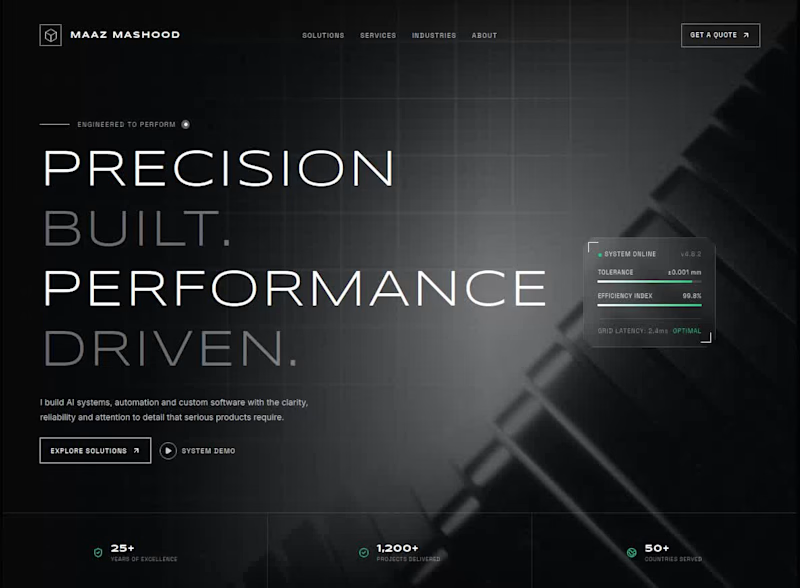
The main goal was to communicate what I do within a few seconds. Instead of vague agency language, I positioned myself clearly as an AI Developer, Automation Engineer and SaaS builder. The headline, “I build AI systems that remove manual work,” makes the value of my work immediately understandable.
I kept the design dark and premium, using charcoal, off-white and a small emerald accent to create a focused technical feel. The grid is intentionally subtle and only appears around the project area, adding structure without making the page feel like a system dashboard.
The layout uses an asymmetric composition. Rather than using fake analytics or decorative 3D objects, I included a believable product view with the actual product name, purpose and technology stack.
Every element guides attention in a natural order: my name, what I do, the problem I solve, the project proof, and finally the services I offer. The buttons are simple and direct so the visitor can either view my work or start a conversation without distractions.