Stop defending Excel. It's costing you more than SAP ever would.
I've seen it too many times.
A warehouse running 3 locations off a shared spreadsheet. 4 versions of the same file. Nobody knows which one is real.
That's not a tool problem. That's a liability.
SAP isn't for everyone — but if your Excel sheet has more than 10 tabs and 3 people editing it, you've already outgrown it.
Here's the honest breakdown:
Excel is fine until:
→ Two people overwrite each other's data
→ A formula breaks and nobody notices for 3 weeks
→ Your auditor asks for a trail and you have nothing
SAP makes sense when:
→ Your ops span multiple sites or entities
→ Finance, procurement, and warehouse need the same data
→ Mistakes have a real cost
The question isn't which is better. It's which one matches where you actually are.
Which one are you using — and are you being honest about whether it's still working?
0
126

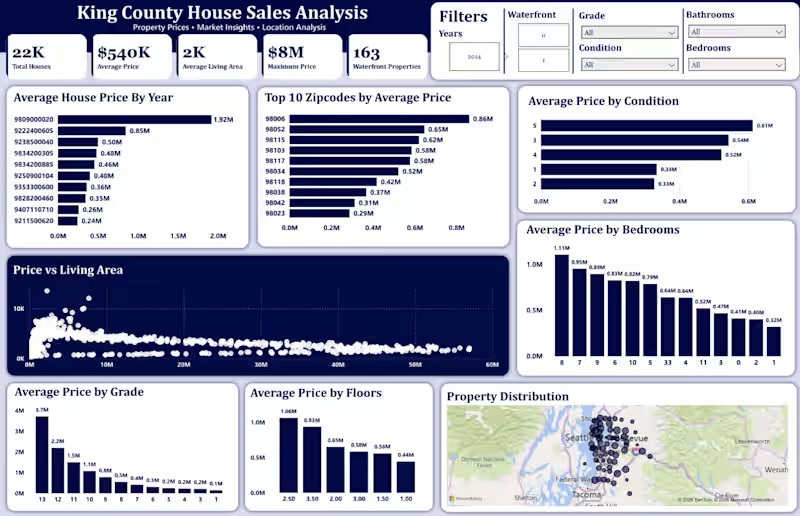
Finally wrapped up the Power BI dashboard for my House Sales Analysis project 🏠📊
After cleaning and exploring the data with Python and writing SQL queries, I used Power BI to turn the analysis into an interactive dashboard.
In the dashboard, I explored:
House price trends
Property size and pricing
House grades
Waterfront vs non-waterfront properties
Location-wise pricing
Bedrooms and other property features
I also worked with DAX measures, slicers, interactive visuals, and KPIs to make the dashboard more useful for exploring the data.
This project helped me practice the complete data analytics workflow:
Python → Data Cleaning & EDA → SQL → Power BI
Still learning and improving with every project. 🚀
#PowerBI #DataAnalyst #DataAnalytics #SQL #Python #EDA #DataCleaning #DAX #BusinessIntelligence #DataVisualization #PowerBIDashboard #PortfolioProject #DataAnalysis
0
68
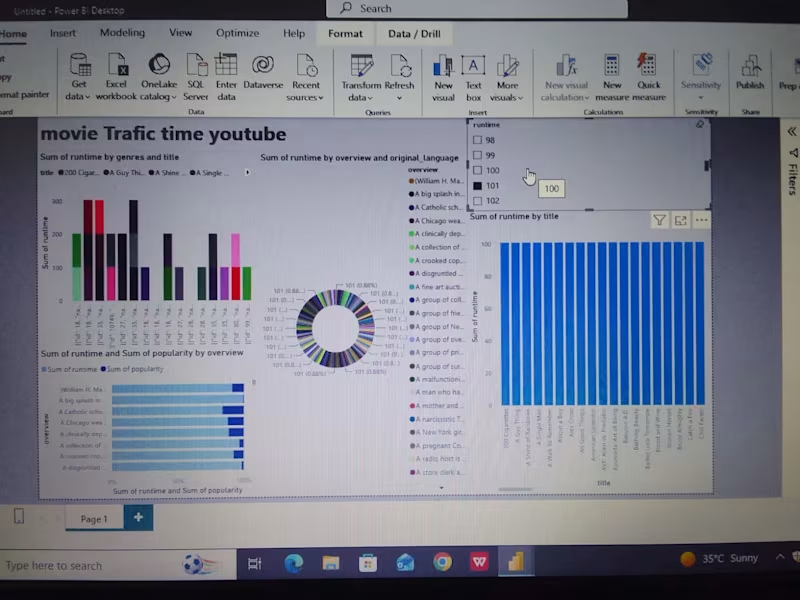
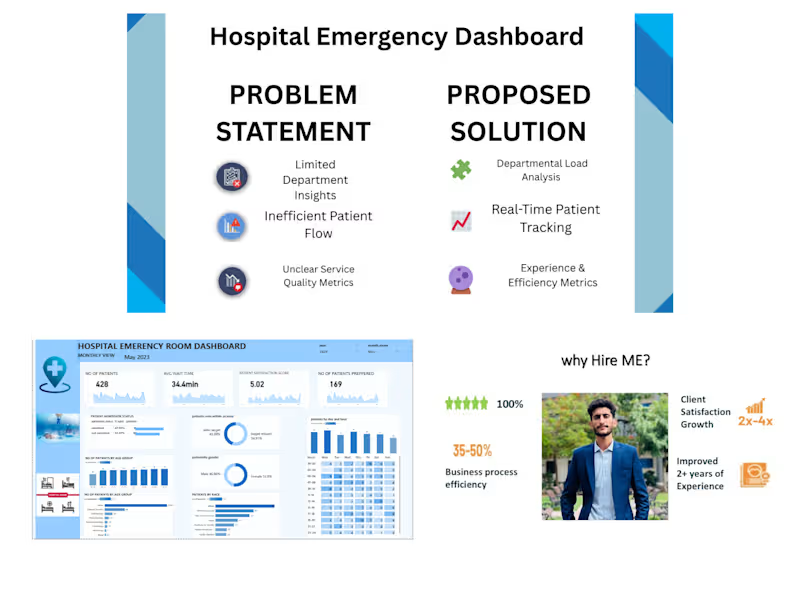
Built an interactive Power BI dashboard to analyze emergency room performance tracking patient flow, wait times, satisfaction scores, and department referrals in real time.
The dashboard helps hospital teams identify bottlenecks, manage resources efficiently, and improve overall patient experience through clear, data-driven insights.
This project highlights how healthcare data can be transformed into actionable intelligence that supports faster decisions and better care outcomes.
1
72
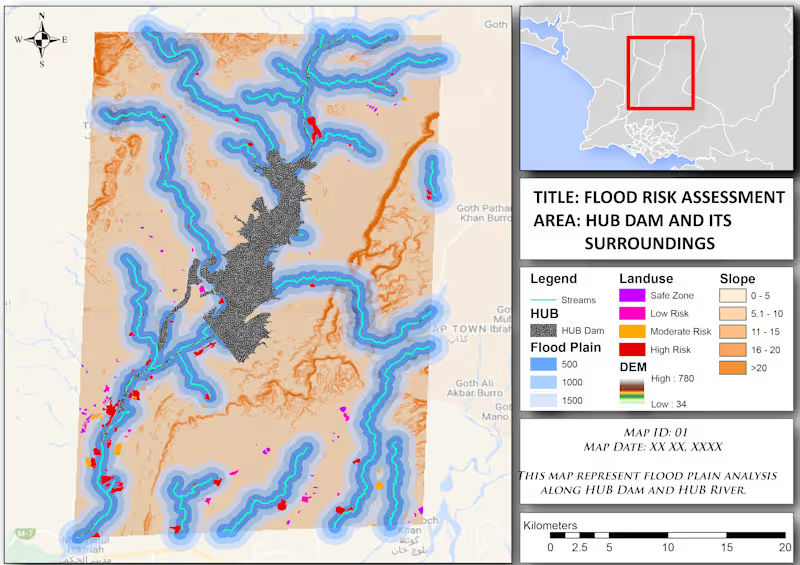
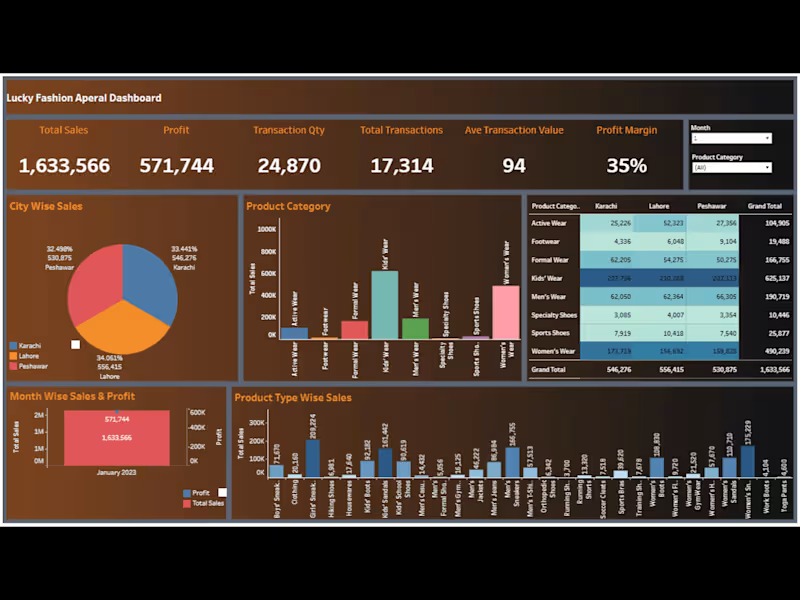
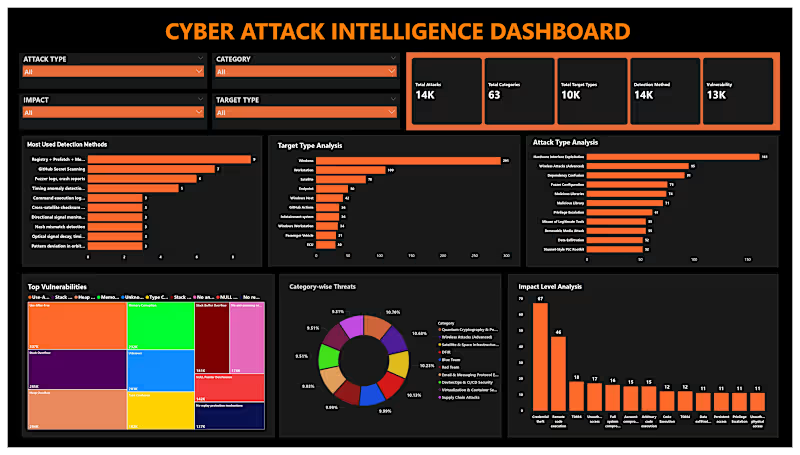
Cyber Security Analytics Dashboard 🔐📊
Cybersecurity is more than detecting threats—it's about turning security data into actionable insights.
In this Power BI dashboard, I analyzed cybersecurity data to monitor security incidents, attack patterns, threat severity, affected systems, and overall security KPIs. The interactive dashboard helps organizations identify risks, improve monitoring, and support faster, data-driven security decisions.
Tools Used:
Power BI
SQL
Python (Data Cleaning & Analysis)
Key Skills:
Cyber Security Analytics | Threat Analysis | Security Dashboard | Risk Analysis | Incident Monitoring | Data Visualization | Business Intelligence | SQL | Python | Power BI | Data Analytics
#PowerBI #CyberSecurity #CyberSecurityAnalytics #ThreatIntelligence #DataAnalytics #BusinessIntelligence #DashboardDesign #SQL #Python #DataVisualization #DataAnalyst #PortfolioProject #SecurityAnalytics
0
94