Data Visualization Projects in KanpurData Visualization Projects in KanpurTitle
Executive Business Performance Dashboard (Power BI)
Description
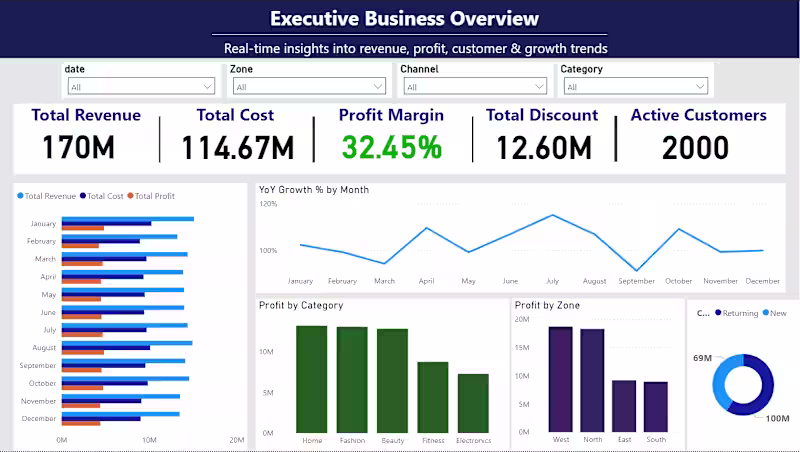
I designed an Executive-level Business Intelligence Dashboard in Power BI that delivers real-time insights into revenue, profitability, customer behavior, and growth trends.
This dashboard is built for founders, managers, and decision-makers who need clarity—not clutter.
What This Dashboard Solves
Understand revenue, cost, and profit margin at a glance
Track YoY growth trends and monthly performance
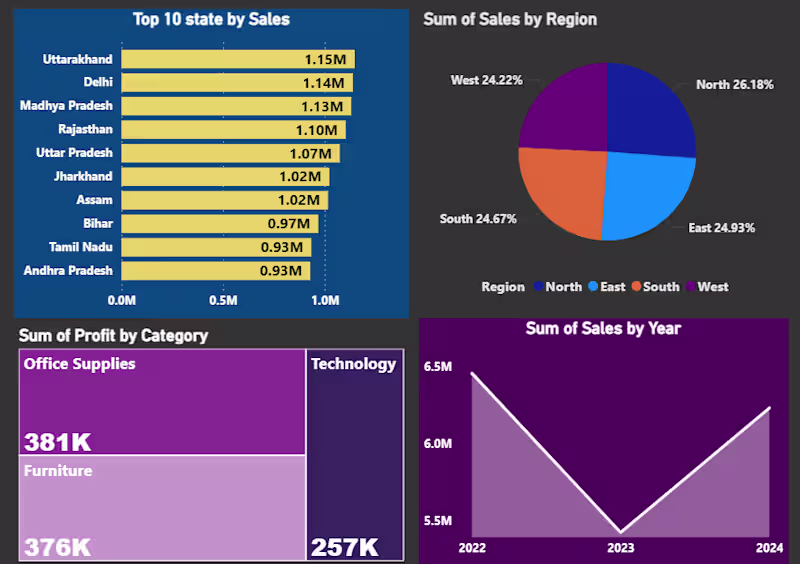
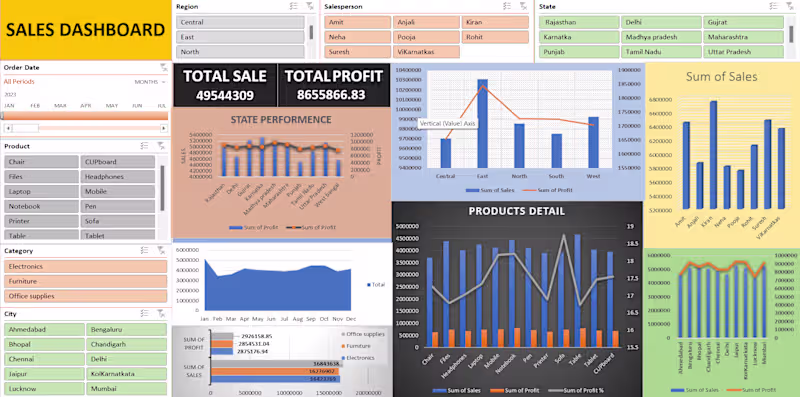
Identify top-performing categories, regions, and channels
Analyze active customers, AOV, and customer profitability
Compare new vs returning customers
Enable data-driven executive decisions
you need a custom Power BI dashboard tailored to your business, let’s connect.