Freelance Data Visualizers in Kanpur
Freelance Data Visualizers in Kanpur
Sign Up
Post a job
Sign Up
Log In
Filters
2
Projects
People
Alok Tripathi
Kanpur, India
Aspiring Data Analyst skilled in Power BI & dashboards
New to Contra
Follow
Message
Aspiring Data Analyst skilled in Power BI & dashboards
4
Looking for a professional Power BI dashboard that delivers real insights, not just charts? I will design clean, interactive, and executive-level Power BI dashboards that help you analyze data, track KPIs, and make better decisions. What I offer: Professional Power BI dashboards & reports Single-page or multi-page dashboards KPIs, charts, and interactive slicers DAX measures & calculations Conditional formatting and drill-down analysis Export-ready tables and reports Clean and business-friendly design Tools & Skills: Microsoft Power BI DAX Power Query Data modeling Ideal for: Business & sales dashboards KPI and performance reporting Government or public data analysis Academic and portfolio projects You will receive the .pbix Power BI file and full guidance if needed.
4
84
6
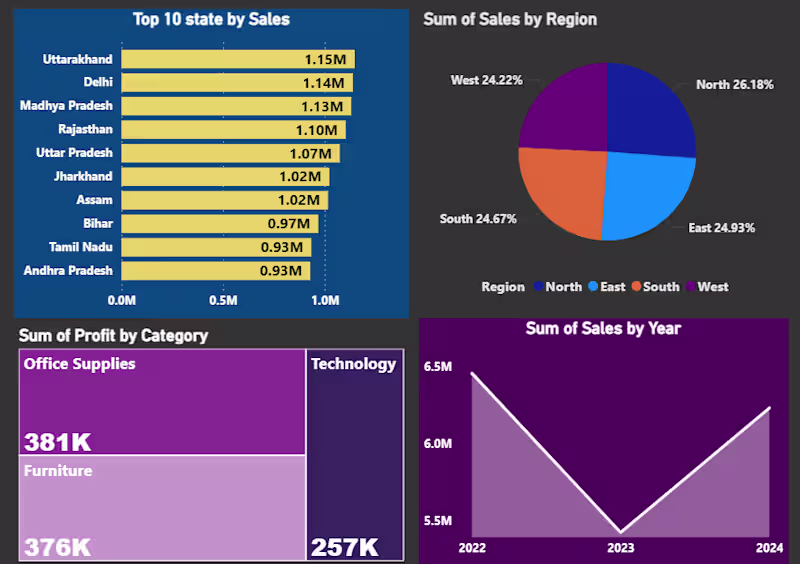
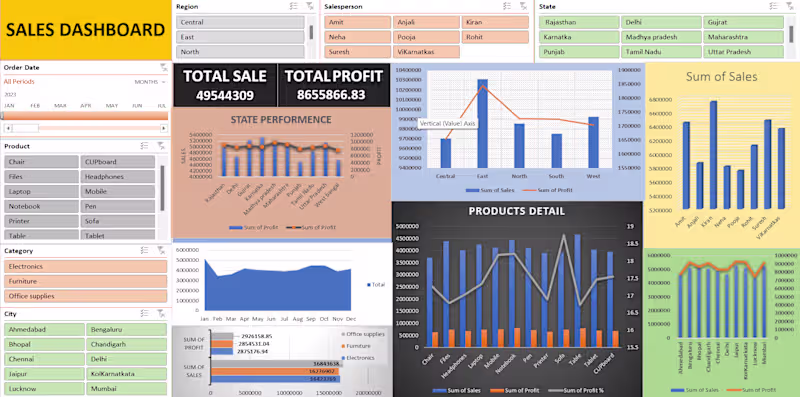
I will create professional Excel dashboards using your data to analyze sales, profit, performance, and trends. My dashboards are clean, easy to use, and designed for real business needs. What I offer: Excel dashboards with charts and visuals Pivot tables and data analysis Interactive slicers and filters Sales, profit, and performance tracking Clean and organized data layout Why choose me: Accurate and clear analysis Fast delivery Easy communication Revisions until satisfaction (as per package) Use cases: Sales & revenue analysis Business performance dashboards Product & region-wise reports Monthly or yearly reporting Please message me before placing an order to discuss your data and requirements.
4
6
100
3
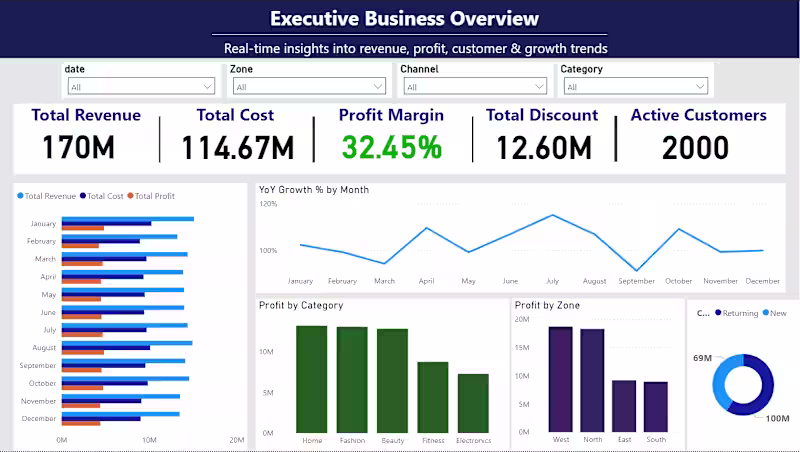
Title Executive Business Performance Dashboard (Power BI) Description I designed an Executive-level Business Intelligence Dashboard in Power BI that delivers real-time insights into revenue, profitability, customer behavior, and growth trends. This dashboard is built for founders, managers, and decision-makers who need clarity—not clutter. What This Dashboard Solves Understand revenue, cost, and profit margin at a glance Track YoY growth trends and monthly performance Identify top-performing categories, regions, and channels Analyze active customers, AOV, and customer profitability Compare new vs returning customers Enable data-driven executive decisions you need a custom Power BI dashboard tailored to your business, let’s connect.
4
3
82
2
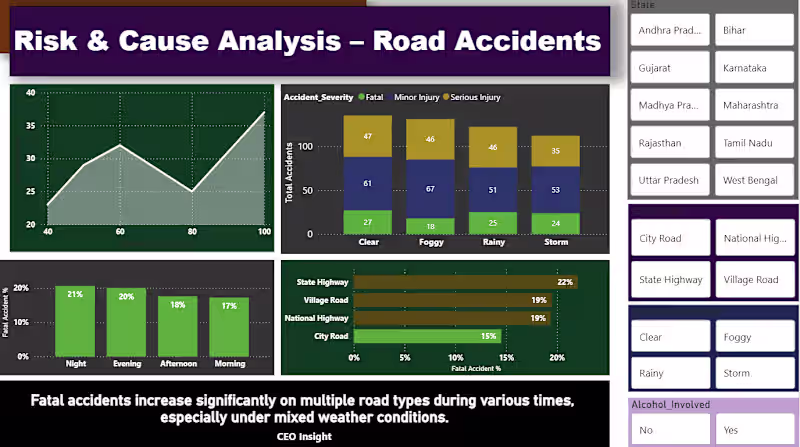
Data Analytics dashboards using Excel & Power BI. I focus on cleaning raw data, creating clear visualizations, and delivering insights that help clients understand performance and make better decisions. #DataAnalytics #PowerBI #Excel #Dashboards
1
2
56
Data Visualizer
(4)
Follow
Message
Explore people