Freelance Data Visualizers in Kagal
Freelance Data Visualizers in Kagal
Sign Up
Post a job
Sign Up
Log In
Filters
2
Projects
People
Abu Aasif Ansari
Kagal, India
I help businesses fix messy data and build dashboards
New to Contra
Follow
Message
I help businesses fix messy data and build dashboards
0
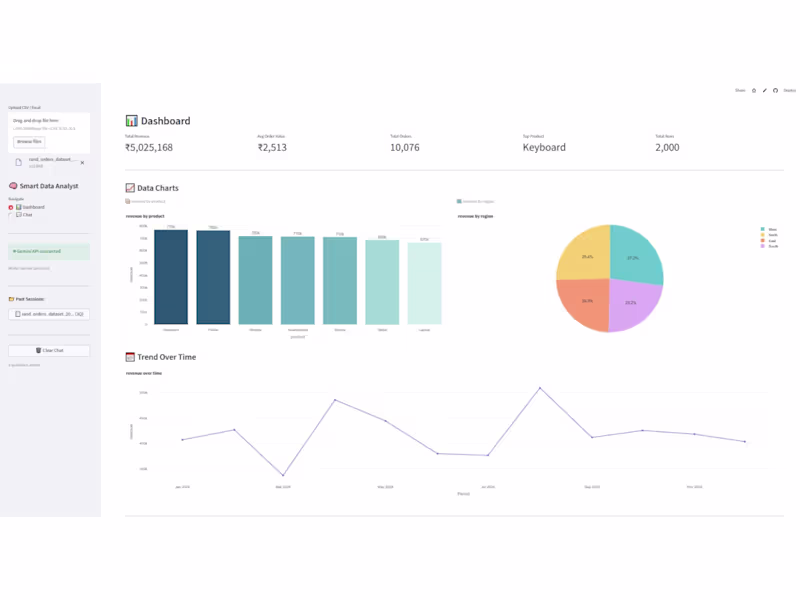
Smart Data Analyst — AI-Powered Data Analysis App Built a fully working AI-powered data analysis app from scratch using Streamlit and Gemini API. The problem: Most business owners have data in Excel or CSV files but no easy way to analyze it without hiring a full-time analyst or learning Python. So I built a tool where you just upload your file — and the app does the rest. → Auto-detects KPIs from any dataset → Generates charts automatically → Ask questions in plain English — get instant answers with tables and charts → Downloads full PDF report with KPIs and charts → RAG memory — remembers past questions Tech: Streamlit · Gemini API · Python · Pandas · Plotly 🔗 Live: https://smart-data-analyst-ahkz32vjd6dzvhmexkrhdm.streamlit.app/ (https://smart-data-analyst-ahkz32vjd6dzvhmexkrhdm.streamlit.app/)⭐ GitHub: https://github.com/AbuAsifAnsari/smart-data-analyst (https://github.com/AbuAsifAnsari/smart-data-analyst)
0
65
2
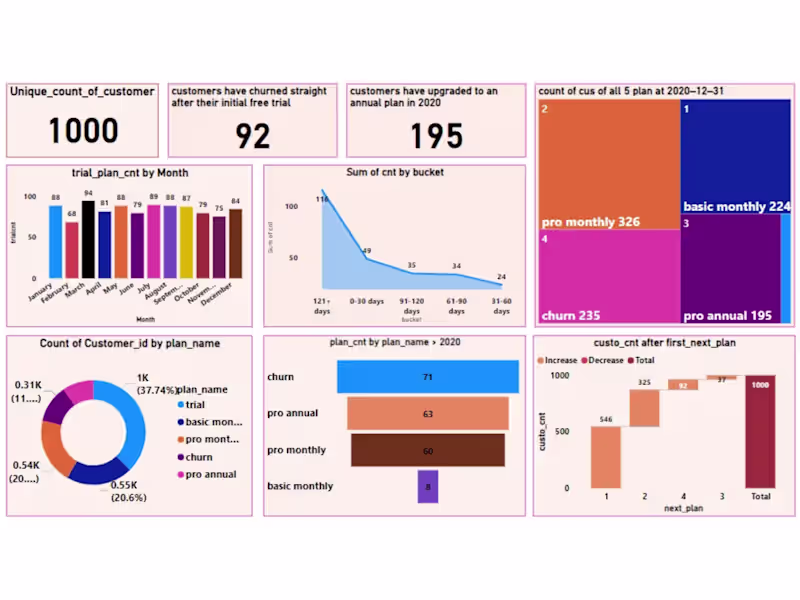
Data Analytics Project – Subscription Model Analysis (SQL & Power BI) Analyzed a subscription-based business model for Foodie-Fi (TastyStream), a digital platform offering on-demand global cuisine content. The objective was to understand customer journeys, subscription transitions, and revenue performance using SQL and Power BI. Key Contributions & Insights: Segmented customers based on trial-to-paid and plan transitions. Analyzed free trial behavior and conversion patterns. Evaluated revenue performance across subscription plans. Built interactive dashboards in Power BI for actionable insights. Tools Used: MYSQL, Power BI Outcome: Delivered a clear, insight-driven dashboard supporting data-driven decisions in a subscription-based business.
2
229
0
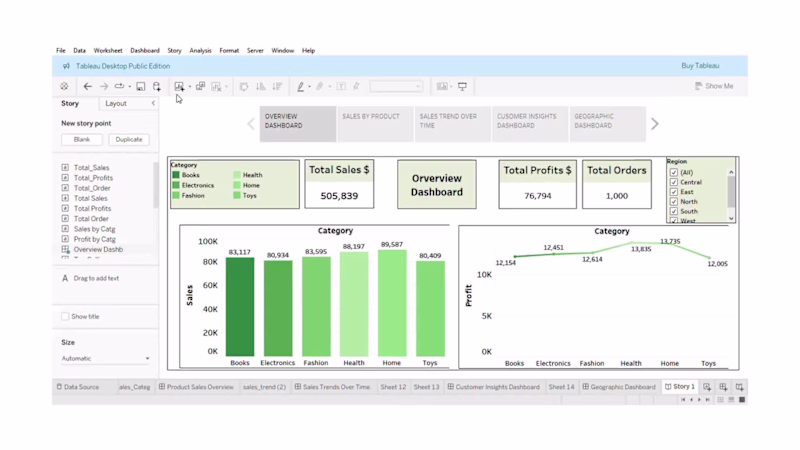
🚀 SQL & Tableau Project | Sales Analytics Dashboard To practice real-world analytics, I built an interactive Sales Analytics Dashboard using SQL & Tableau to analyze sales performance and customer behavior. 🔹 Dataset Highlights OrderID, CustomerID, Product, Category, Sales, Quantity, Discount, Profit, Region, OrderDate 🔹 Dashboard Coverage • Sales overview: Total Sales, Profit & Orders • Product performance: Top-selling products & category insights • Monthly sales trends 🔹 Tools Used • SQL • Tableau 🔹 Key Insights • A small customer segment drives most revenue • Certain product categories consistently outperform others • Clear seasonal sales patterns 🔹 What I Learned • Writing efficient SQL queries for analysis • Translating numbers into business-friendly visuals • Designing dashboards that support data-driven decisions
0
172
0
CUT Coffee — Brew Your Story I reimagined CapCut as a premium coffee brand for creators. The scissors become a cup mark. The timeline becomes a film-strip sleeve. Every great story begins with a cut. Direction A — CapCut as a Different Industry https://www.linkedin.com/posts/abuaasif_capcutdesignstudio-branddesign-capcut-activity-7467333219772952576-53vt?utm_source=share&utm_medium=member_desktop&rcm=ACoAACRm5rcB0nVG0_HUX6-IXfuWqNGquZ-jMQU
0
70
Data Visualizer
(3)
Follow
Message
Explore people