Projects using Power Apps in HyderabadProjects using Power Apps in HyderabadE-commerce Sales Analytics Dashboard - Power BI | ₹3.27M Revenue Tracking
Client Problem:
2K customers, 8K orders in Excel. Owner had no idea which products actually make profit, which category drives customers.
Dashboard Solution - 6 KPIs + 6 Visuals:
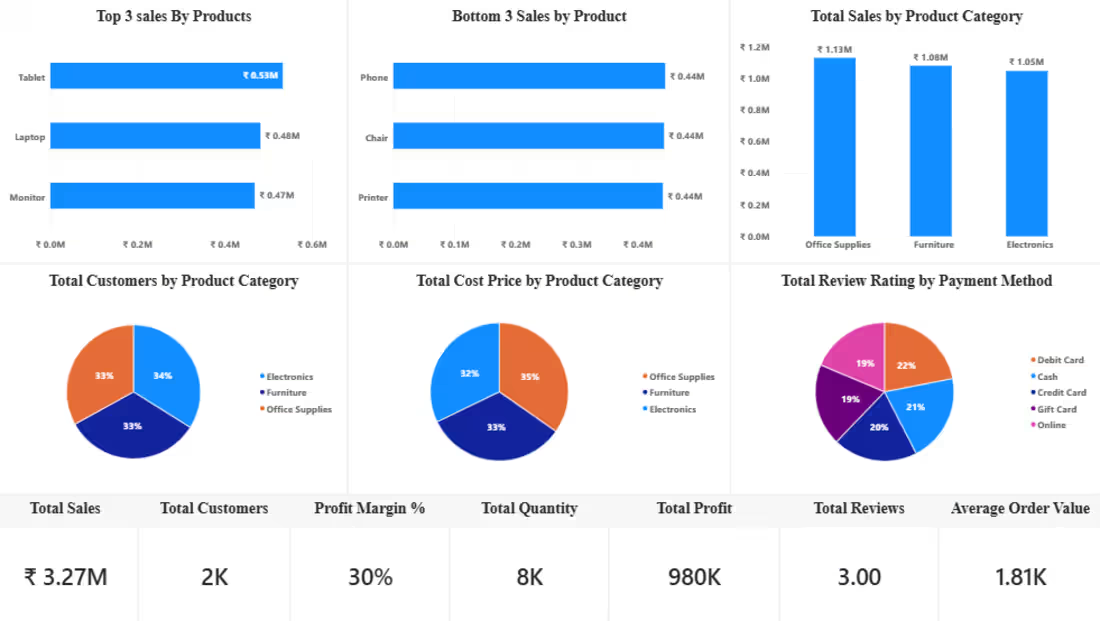
Top 3 Sales: Tablet ₹0.53M | Laptop ₹0.48M | Monitor ₹0.47M
Bottom 3 Sales: Phone, Chair, Printer - Clear underperformers to discount
Sales by Category: Office Supplies ₹1.19M leads Furniture & Electronics
Customer Mix: Electronics 34%, Office 33%, Furniture 33% - Balanced
Cost Price by Category - 39% Office Supplies cost
Review Rating by Payment: Credit Card 29% top, Debit 22% - Improve COD experience
KPIs at Bottom:
Total Sales ₹3.27M | Customers 2K | Margin 30% | Qty 8K | Profit 980K | AOV 1.81K | Rating 3.0
Impact:
Client stopped pushing low-margin Phone/Chair, focused on Tablet/Office Supplies. Increased profit from 30% to 38% in 45 days
Tools: Power BI, DAX, Sales Analytics
For: E-commerce, Retail Stores, D2C Brands. Insurance Portfolio Dashboard - Power BI | $5M Premium Tracking
Client Problem:
Insurance agency tracking 10K policies in Excel - no clarity on which age group claims more, which policy type is profitable.
Dashboard I Built:
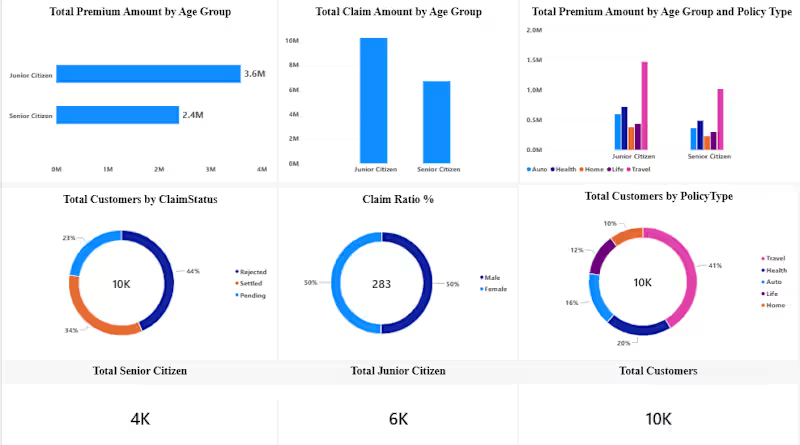
Premium vs Claim Analysis by Age Group (Junior 6K vs Senior 4K)
Claim Status Breakdown: 44% Settled, 34% Pending, 22% Rejected
Claim Ratio % by Gender
Customers by Policy Type: Travel 41%, Auto 20%, Home 16%, Health 12%, Life 11%
KPIs: Total Customers 10K | Senior 4K | Junior 6K | Premium 5M
Business Impact:
Client found Senior Citizens claim 2x more vs Junior, and Travel policy is top seller. Helped them re-price premiums and save $50K in risk.
Tools: Power BI, DAX, Data Modelling, Excel
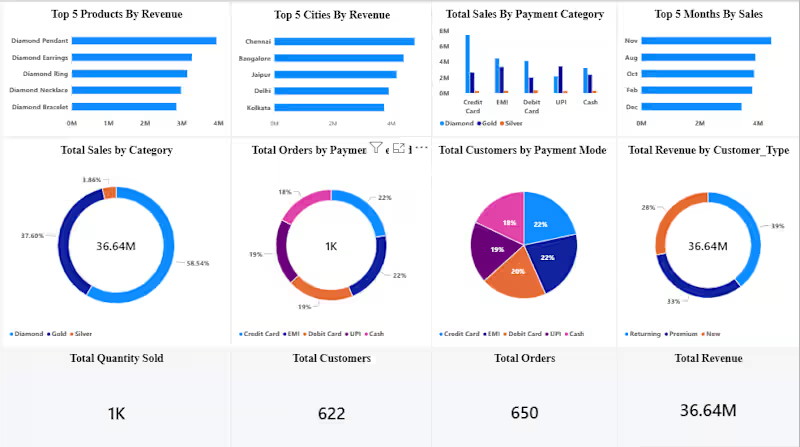
Timeline: 2 Days | For: Insurance Brokers / Agencies. Jewellery E-commerce Sales Dashboard - Power BI | 36.64M Revenue
The Problem:
Client had sales data scattered across Excel - couldn't see which product, city, or payment mode drives revenue.
What I Built:
Single CEO dashboard with:
• Top 5 Products & Cities by Revenue
• Sales by Category (Diamond, Gold, Silver)
• Payment Analysis (Credit, EMI, UPI, Cash)
• Customer Type - Returning vs New
• KPIs: 1K orders | 622 customers | 36.64M revenue
The Result:
Owner now sees best-selling Diamond Pendant & Chennai as top city in 5 seconds. No more manual Excel.
Stack: Power BI, DAX, Power Query, Excel
Timeline: 2 days