Business Analysis Projects in Hyderabad
Business Analysis Projects in Hyderabad
Sign Up
Post a job
Sign Up
Log In
Filters
2
Projects
People
Message
5
Geethasree Naguboina
pro
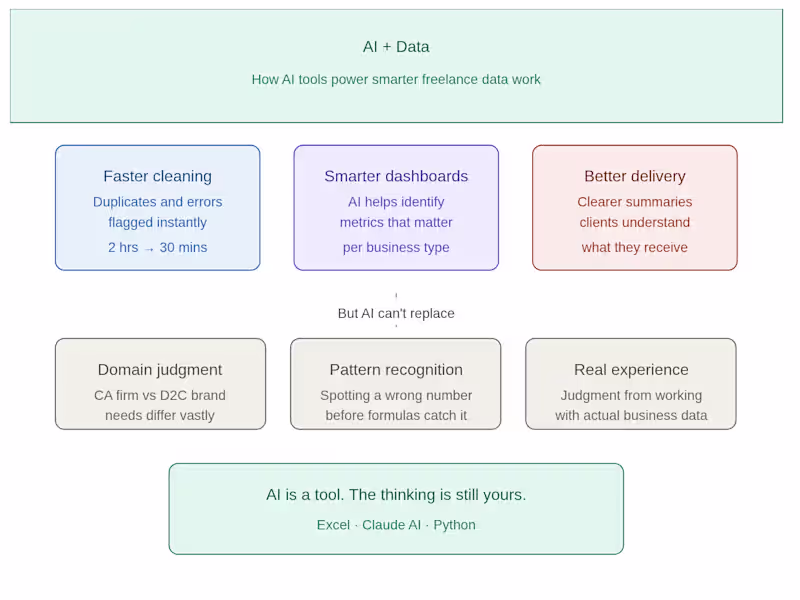
I used to spend hours cleaning messy Excel files manually. Now? I use AI tools to cut that time in half — and deliver better results to my clients. Here's how AI has changed my freelance data workflow: 🔹 Faster data cleaning Instead of manually hunting for duplicates and formatting errors, I use AI to flag inconsistencies instantly. What used to take 2 hours now takes 30 minutes. 🔹 Smarter dashboard structure Before building any dashboard, I use AI to help me think through what metrics actually matter for that specific business — not just what looks good. 🔹 Better client communication I use AI to help me write clearer project summaries and delivery notes — so clients understand exactly what they're getting and why it matters. But here's what AI can't replace: ✔ Understanding what a CA firm actually needs vs what a D2C brand needs ✔ Knowing when a number looks wrong before the formula catches it ✔ The judgment that comes from actually working with real business data AI is a tool. The thinking is still yours. If you're a small business owner or CA firm drowning in Excel data — I can help you turn it into something you can actually use. DM me or check my portfolio 👇 geethasree-data-support-cr241o7.gamma.site (http://geethasree-data-support-cr241o7.gamma.site)
3
5
399
Message
1
Mujtaba Quadri
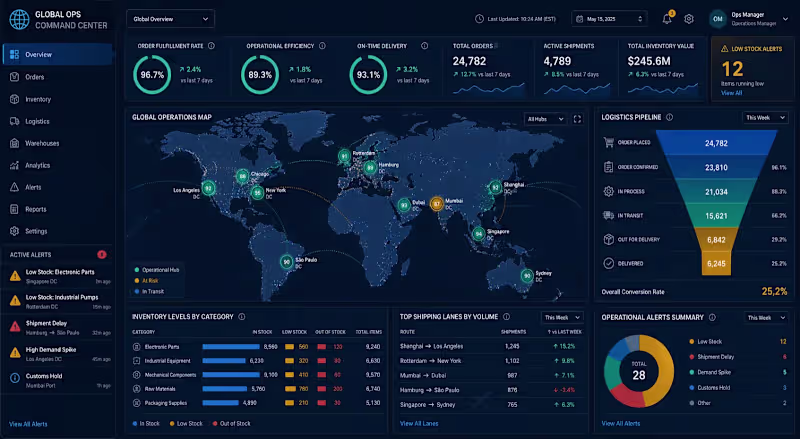
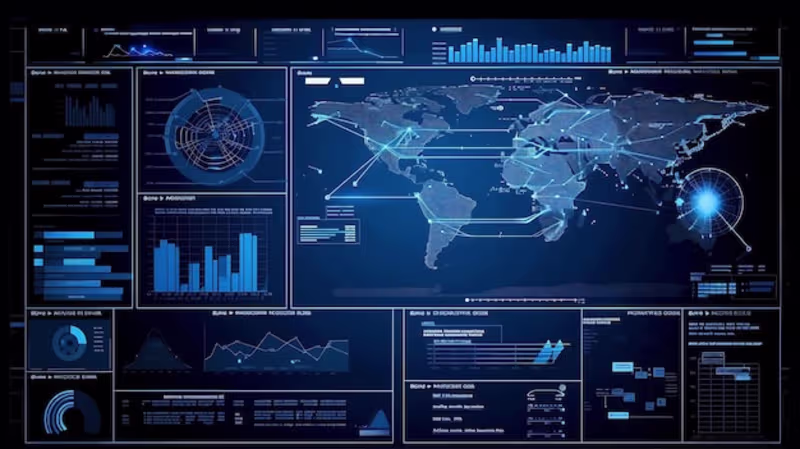
This Project Focused On The Architecture Of A Dynamic Operational Command Center Designed To Optimize Global Supply Chain Logistics And Inventory Management. By Integrating Multi-Source Data Streams Using Advanced SQL Querying, The System Provides Real-Time Visibility Into Key Performance Indicators Such As Order Fulfillment Latency, Inventory Turnover Ratios, And Regional Delivery Success Rates. Utilizing Sophisticated Data Visualization Techniques, The Dashboard Empowers Stakeholders To Identify Logistics Bottlenecks And Streamline Warehouse Operations. The Implementation Of Automated Trend Analysis Facilitated A Significant Reduction In Stock-Out Incidents And Enhanced Overall Operational Efficiency By Providing Granular Insights Into The End-To-End Supply Chain Lifecycle.
1
59
Message
0
Ganga Kusi
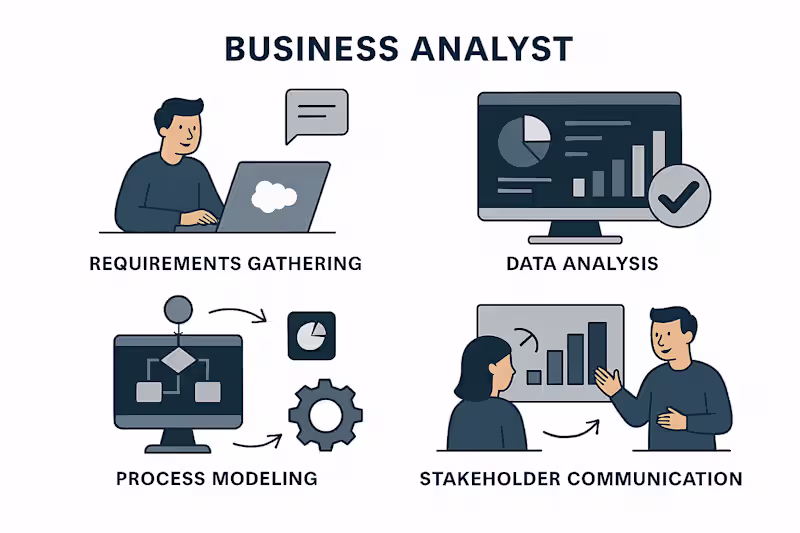
Business Analyst Requirements Gathering – Collecting and documenting business needs. Data Analysis – Interpreting data and creating actionable insights. Process Modeling – Designing workflows and process diagrams. Stakeholder Communication – Presenting findings and aligning with stakeholders.
0
27
Message
0
Sunkara Tarun
Team Frigates, Electric Go-Kart, and Team Leader (Automobile)
0
13
Message
0
Yedla Naga Sathvik
Sathvik2023/Amazon-Product-Sales-Analysis
0
1
Message
0
Srinivas Bharadwaj Jonnavithula
Strategic Market Entry for a Tech Startup
0
36
Message
0
Chandrika Mekala
Nextenti - An AI healthcare staffing solution
0
0
Message
3
Geethasree Naguboina
pro
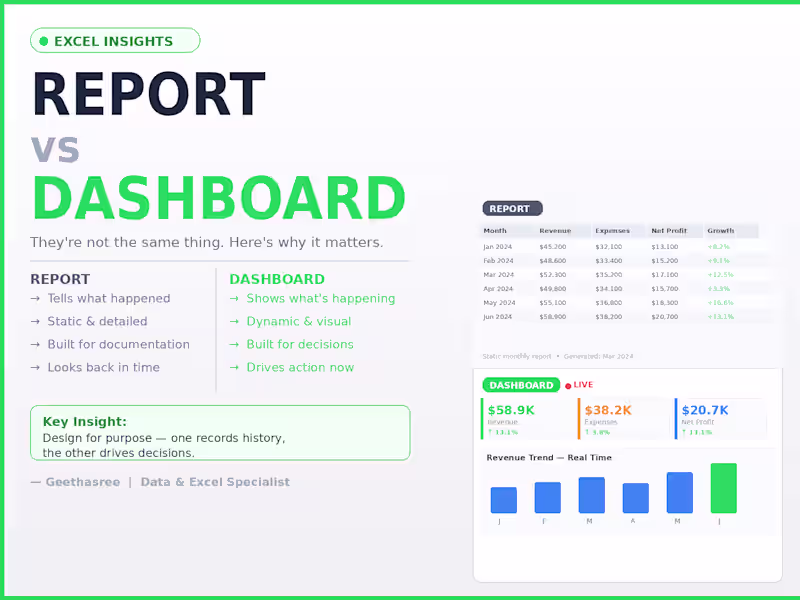
The difference between a report and a dashboard Most people use these words interchangeably. They're not the same thing. A report tells you what happened. A dashboard shows you what's happening. The difference: Report → static, detailed, built for documentation Dashboard → dynamic, visual, built for decisions The mistake I see most often: People build dashboards that are actually just reports. The result? — Decision makers scroll through pages of data — Numbers are outdated by the time anyone reads them — No one knows what to act on The fix is simple: A report answers: "What happened last month?" A dashboard answers: "What do I need to do right now?" When you design for the right purpose: Reports become clear records. Dashboards become decision tools. One looks back. The other drives forward.
2
3
209
Message
1
Mujtaba Quadri
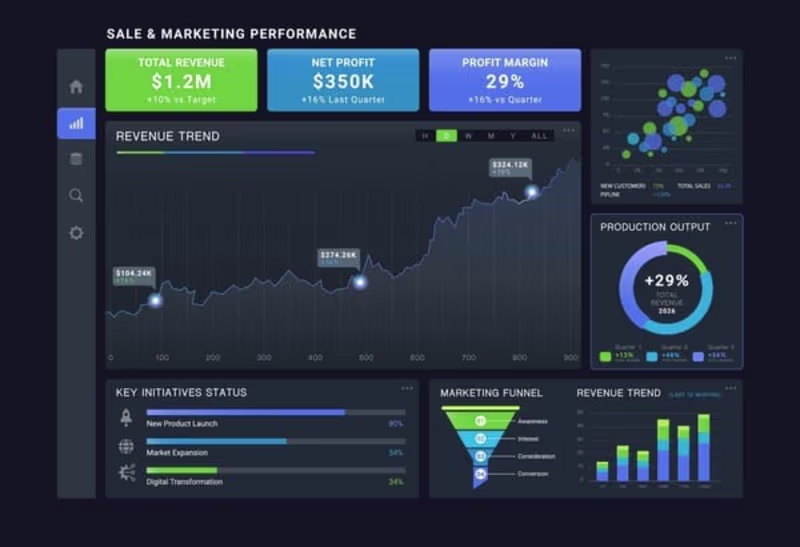
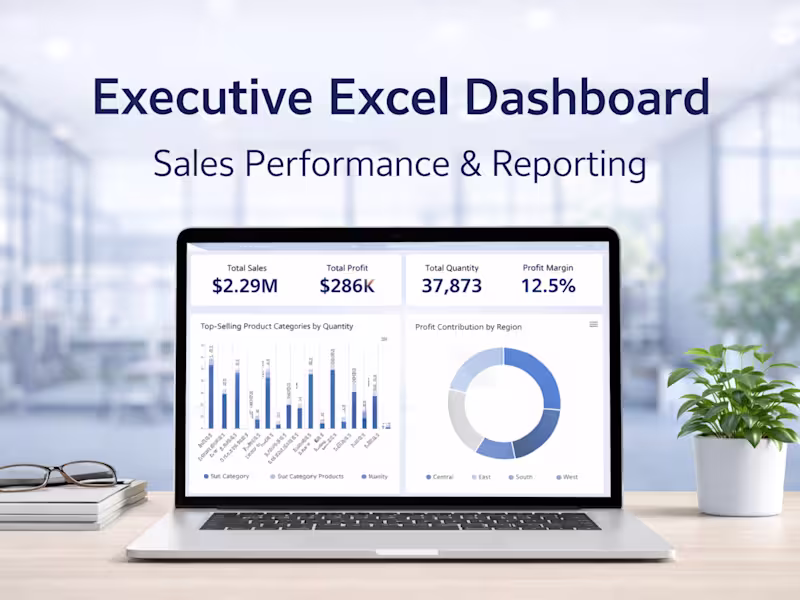
"I Designed A Comprehensive Sales Performance Dashboard To Track Key Business Metrics Across Multiple Regions. By Integrating Raw Data Into A Dynamic Visual Interface, I Provided Leadership With Real-Time Insights Into Profit Margins, Regional Growth, And Product Performance, Enabling Data-Driven Strategy Decisions That Optimized Inventory Allocation."
1
84
Message
6
Geethasree Naguboina
pro
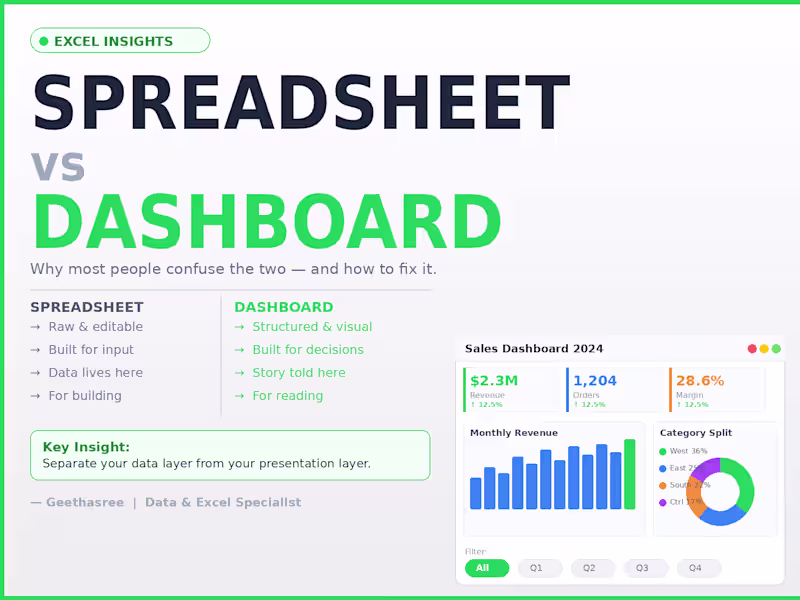
Most people think a spreadsheet and a dashboard are the same thing. They're not. A spreadsheet is where data lives. A dashboard is where decisions happen. The difference: Spreadsheet → raw, editable, flexible, built for input Dashboard → structured, visual, built for reading and decisions The mistake I see most often: People try to do both in the same sheet. The result? Decision makers see too much raw data Numbers get accidentally edited No one knows what to trust The fix is simple: Keep your data layer and your presentation layer separate. Raw data in one sheet. Dashboard in another. One is for building. One is for reading. When you separate them, updates become clean, mistakes become rare, and your reports actually get used. A spreadsheet stores your data. A dashboard tells its story.
4
6
226
Message
1
Mujtaba Quadri
"I Developed A SQL-Driven Monitoring System For A Global Supply Chain Network. By Writing Complex Queries To Analyze Inventory Levels Across Multiple International Warehouses, I Created An Automated Flagging System For Low-Stock Items. This Project Demonstrates My Ability To Handle Large-Scale Relational Databases And Provide Actionable Logistics Insights."
1
86
Message
4
Geethasree Naguboina
pro
Executive Excel Dashboard for Business Reporting
4
8
Explore projects