Projects in HilsaProjects in HilsaTurning a client’s requirement into something that actually works.
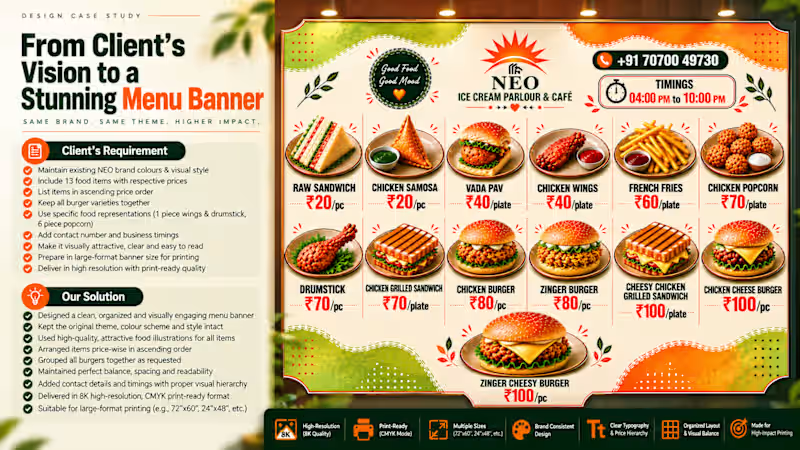
🎨Recently, we got the opportunity to work on a large-format menu banner for NEO Ice Cream Parlour and Café.
The brief sounded simple ,showcase the complete menu, prices and food items in an attractive way. But, the real challenge was making multiple food items, different price points, brand elements and contact information fit together without making the design feel crowded. So, we focused on keeping the existing NEO colour palette and visual identity, while improving the hierarchy, spacing, food representations and overall readability. The final design was prepared with large-format printing in mind, with high-resolution visuals, CMYK workflow and an 8K-quality output. What we enjoyed most about this project was finding the balance between visual appeal and practical communication because a menu shouldn't just look good, it should also make it easy for someone to understand what they're getting and how much it costs. A small reminder for myself from this project: Good design isn't about adding more. Its about making every element work together.
Would love to know what you think about the final execution. 👀
#GraphicDesign (https://www.linkedin.com/search/results/all/?keywords=%23graphicdesign&origin=HASH_TAG_FROM_FEED) #MenuDesign (https://www.linkedin.com/search/results/all/?keywords=%23menudesign&origin=HASH_TAG_FROM_FEED) #PrintDesign (https://www.linkedin.com/search/results/all/?keywords=%23printdesign&origin=HASH_TAG_FROM_FEED) #Branding (https://www.linkedin.com/search/results/all/?keywords=%23branding&origin=HASH_TAG_FROM_FEED) #FoodBranding (https://www.linkedin.com/search/results/all/?keywords=%23foodbranding&origin=HASH_TAG_FROM_FEED) #LargeFormatDesign (https://www.linkedin.com/search/results/all/?keywords=%23largeformatdesign&origin=HASH_TAG_FROM_FEED) #VisualDesign (https://www.linkedin.com/search/results/all/?keywords=%23visualdesign&origin=HASH_TAG_FROM_FEED) #GraphicDesigner (https://www.linkedin.com/search/results/all/?keywords=%23graphicdesigner&origin=HASH_TAG_FROM_FEED) #DesignProcess (https://www.linkedin.com/search/results/all/?keywords=%23designprocess&origin=HASH_TAG_FROM_FEED) #CMYK (https://www.linkedin.com/search/results/all/?keywords=%23cmyk&origin=HASH_TAG_FROM_FEED) #8KDesign (https://www.linkedin.com/search/results/all/?keywords=%238kdesign&origin=HASH_TAG_FROM_FEED) #RestaurantBranding (https://www.linkedin.com/search/results/all/?keywords=%23restaurantbranding&origin=HASH_TAG_FROM_FEED) AI-Assisted Architectural & Urban Visualization (ComfyUI + FLUX)
Transforming raw 3D massing, CAD files, or 2D sketches into hyper-realistic commercial and architectural environments using a custom, geometry-locked ComfyUI workflow.
What I Do & How It Works:
Real-World Geo-Location Integration: I take a client's 2D layout, sketch, or 3D block model and integrate it precisely into its exact real-world location and surroundings using satellite and context data.
Advanced AI Pipelines: By combining generative AI platforms with advanced custom node setups in ComfyUI (utilizing ControlNet depth mapping, Canny, and IP-Adapter), I preserve the original structure and strict architectural proportions.
Photorealistic Materials & Lighting: Raw structures are upgraded to feature realistic day/night lighting, high-end materials, urban context, and landscaping.
Versatile Applications: Whether it's high-rise towers, commercial real estate complexes, residential buildings, or industrial open storage/logistics yards, this pipeline cuts down traditional 3D rendering time while maintaining professional precision.
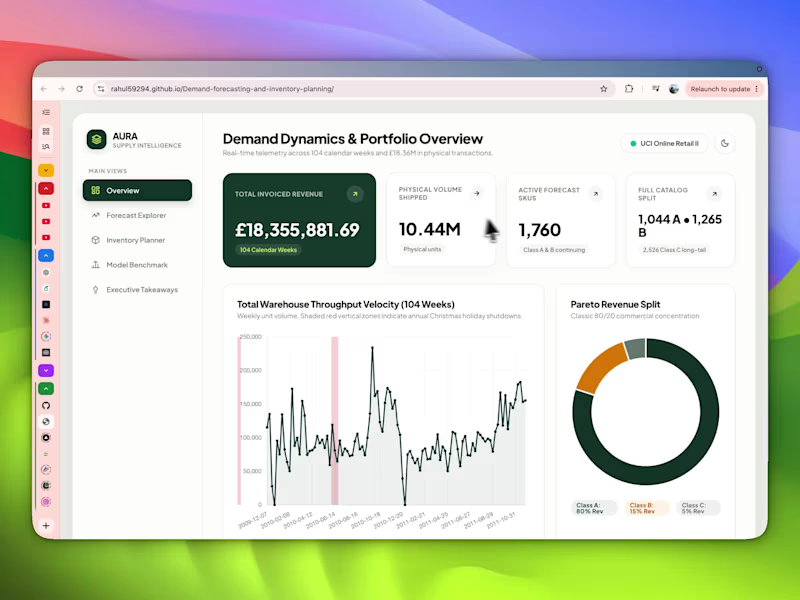
Open to select architectural, real estate, and product visualization projects. Feel free to connect or drop a message to discuss potential collaborations. Demand Forecasting & Inventory Optimization — Cut Simulated Stockouts from 20% to 11%
The Problem
A recurring pain point for retail and e-commerce businesses: how much stock to hold per product, and when to reorder — without either running out (lost sales) or over-ordering (wasted capital). I built this project end-to-end on a real 2-year, 1M+ row UK online retail transaction dataset to show how that decision can be made with data instead of guesswork.
What I Did
Cleaned 1M+ raw transactions: resolved cancellations, removed non-product entries, and separated one-off wholesale bulk orders from genuine recurring retail demand — a distinction that changed the shape of the demand data significantly.
Classified 1,760 products by revenue impact (ABC/Pareto analysis) and demand behavior (smooth, erratic, intermittent, lumpy — using the Syntetos-Boylan method from supply-chain statistics).
Backtested 9+ forecasting models — from simple moving averages to Croston's Method (for intermittent demand) to a global LightGBM model with quantile regression — using proper rolling-origin backtesting across 3 time periods, including the toughest case: the Q4 holiday demand surge.
Built a full inventory policy: safety stock and reorder points using both classical and non-parametric (quantile-based) methods, simulated against real held-out demand.
Delivered an interactive dashboard (built in HTML/JS, deployed live) so a non-technical stakeholder can explore any product's forecast, view inventory recommendations, and see model performance — no spreadsheet required.
Key Results
Identified that 21.6% of products drive 80% of revenue (classic Pareto effect) — informing where forecasting effort should focus.
Found that unrepeated wholesale bulk orders were distorting demand patterns for a subset of products, and built a cleaning method to separate wholesale noise from real retail demand.
Compared machine learning (LightGBM) against classical time-series methods honestly — reporting where ML wins, where it doesn't, and why (a well-tuned moving average performed comparably at the individual-product level).
Simulated the recommended inventory policy against real Q4 demand: cut stockout weeks from ~20% (naive rule) to ~11%, while explicitly weighing that against a fair (matched-service-level) comparison to a classical method — an honest, non-oversold conclusion.