
AI App Developer | GenAI, NLP, Streamlit, Chatbots, RAG
AI App Developer | GenAI, NLP, Streamlit, Chatbots, RAG


View more →


Engineer building scalable, high-performance solutions.
Engineer building scalable, high-performance solutions.


View more →

Machine Learning Engineer turning data into intelligence
Machine Learning Engineer turning data into intelligence

View more →

Transforming data into actionable insights to drive smarter
Transforming data into actionable insights to drive smarter



View more →

i am a data visualizer
i am a data visualizer
FrostGuard AI – Cold Chain Monitoring & Predictive Rerouting
Overview
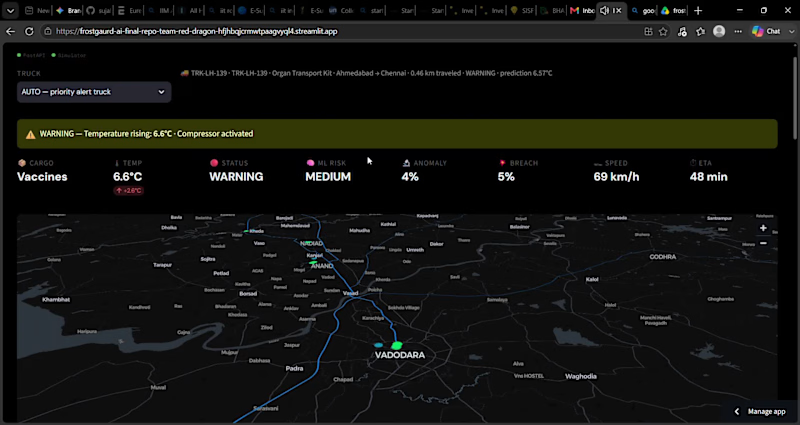
FrostGuard AI is a real-time cold-chain logistics platform built by Team Red Dragon during a hackathon. It monitors a simulated fleet of medical cargo trucks, predicts temperature breaches before they happen using trained ML models, and recommends the nearest cold-storage facility when a shipment is at risk — all rendered on a live geospatial dashboard.
Core Capabilities
Predictive Breach Detection: An Isolation Forest anomaly detector and a HistGradientBoosting-based forecaster (frost_ml.py (http://ml.py), trained via train_model.py (http://model.py)) flag abnormal temperature patterns and forecast breach risk 30 seconds ahead. The trained model is serialized once (frostguard_ml.joblib) and loaded at boot rather than retrained on every startup — keeping cold starts fast on resource-limited hosts.
Nearest-Facility Rerouting: A K-Nearest Neighbors model (scikit-learn) matches an at-risk truck's GPS position to the nearest of 16 cold-storage nodes across India, so operators get an immediate reroute recommendation rather than raw coordinates.
Cached Road Routing: Driving paths between cities are fetched from the OSRM routing engine and precomputed once (precompute_routes.py (http://routes.py) → routes_cache.json), removing a live external API dependency from the app's boot path.
Interactive Dashboard: main_dashboard.py (http://dashboard.py), built with Streamlit, gives operators a live map, fleet metrics, alerts, and a manual failure-injection tool for demoing breach scenarios.
Optional Standalone Services: api.py (http://api.py) (FastAPI) and Bridge.py (http://Bridge.py) (Flask) provide REST endpoints for telemetry ingestion, and Bridge.py (http://Bridge.py) includes a Discord webhook integration that posts an alert when a truck goes CRITICAL — opt-in via a DISCORD_WEBHOOK environment variable. These run independently of the main dashboard and aren't required for it to function.
Technologies: Python, Streamlit, scikit-learn (Isolation Forest, HistGradientBoosting, KNN), Docker, REST APIs, OSRM, Discord Webhooks.
0
59

AI & Python Developer | Web Apps, Automation & AI Video


Data Scientist with AI/ML
Data Scientist with AI/ML


View more →

Data Analyst | Excel, SQL, Python & AI
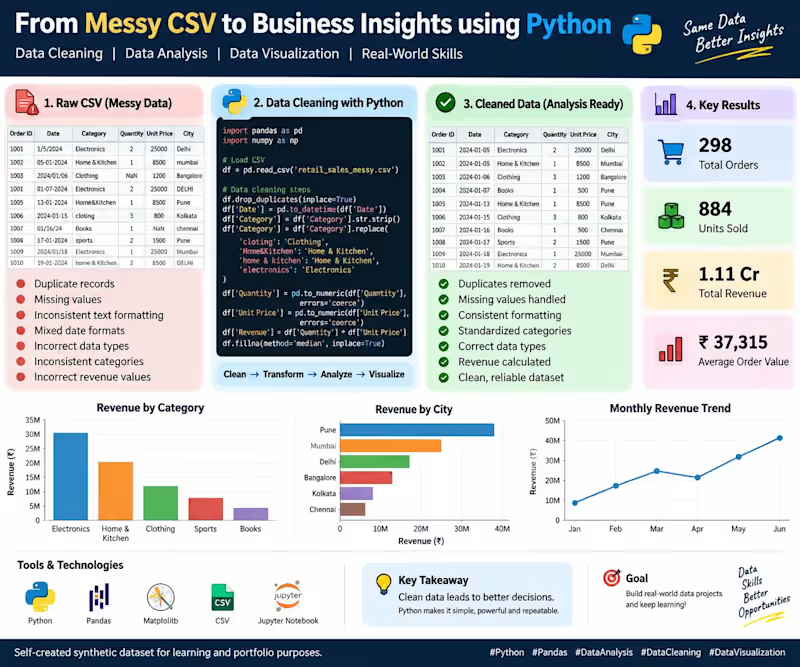
Cleaned and analyzed a synthetic retail sales dataset using Python and Pandas. Loaded and inspected CSV data, standardized text and categories, converted data types, removed duplicate records, handled missing values, recalculated revenue, and validated the cleaned dataset. Performed KPI analysis, revenue analysis by category and city, and monthly revenue trend analysis using Python and Matplotlib. Self-created portfolio project for learning and demonstration purposes.
0
45
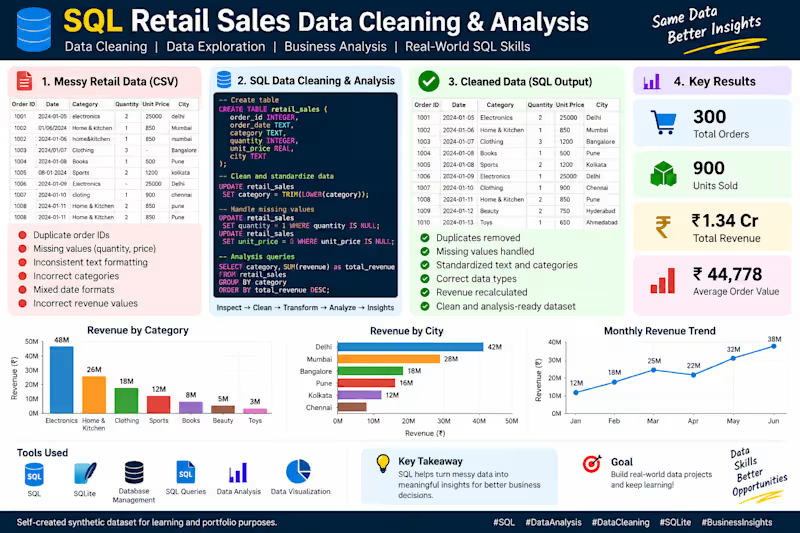
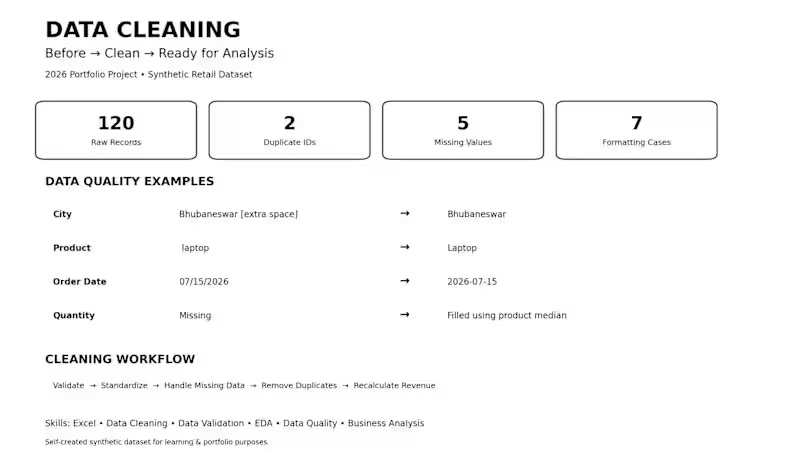
Cleaned and organized a synthetic retail dataset using Microsoft Excel. Identified and addressed duplicate records, missing values, inconsistent city and product formatting, date issues, and data-quality inconsistencies. Standardized the data, handled missing values, removed duplicates, and recalculated revenue to create an analysis-ready dataset. Self-created portfolio project for learning and demonstration purposes.
0
53
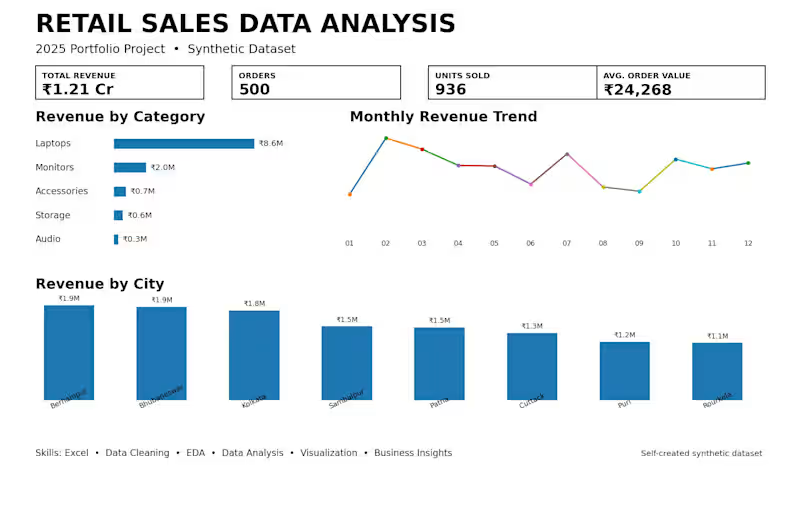
Analyzed a synthetic 2025 retail sales dataset using Microsoft Excel. Performed data cleaning, validation, exploratory data analysis, KPI analysis, revenue analysis, and data visualization to identify product, category, city, and monthly sales trends. Self-created portfolio project for learning and demonstration purposes.
0
45