Freelancers using Keras in Dhaka
Freelancers using Keras in Dhaka
Sign Up
Post a job
Sign Up
Log In
Filters
2
Projects
People
Istiak Ahmed Khan
Dhaka, Bangladesh
Power BI Data Analyst + ML AI Automation Expert
5.0
Rating
101
Followers
Follow
Message
Power BI Data Analyst + ML AI Automation Expert
4
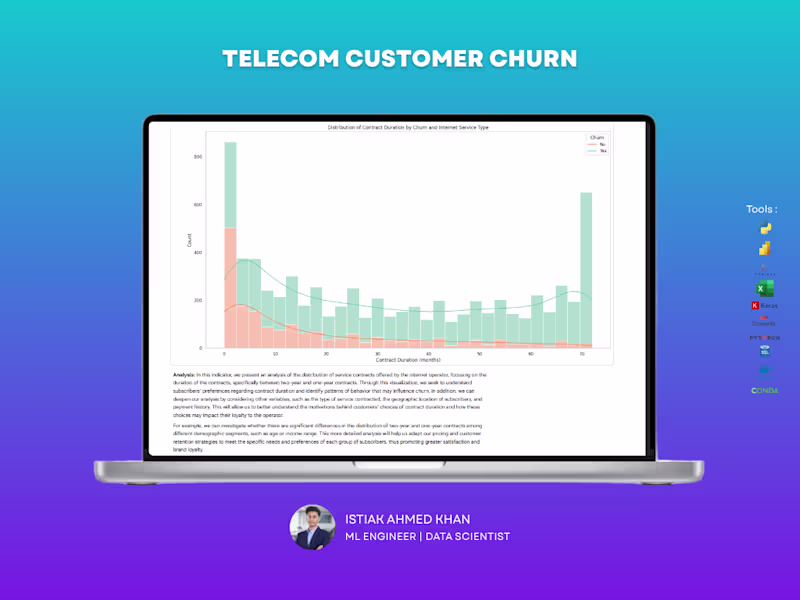
End-to-End Machine Learning Pipeline for Telecom Customer Churn 1. The Business Problem Customer churn is a major challenge for telecommunications companies, driven by competition, service issues, and changing consumer preferences. This project was designed to transition the company from reactive support to proactive retention using data-driven strategies such as customer segmentation, personalized offers, and loyalty programs,. 2. Data Exploration & Insights (EDA) I performed a comprehensive descriptive analysis on a database of 7,043 customers with 21 distinct variables,. Key findings included: Contractual Risk: Customers on month-to-month contracts showed significantly higher churn compared to those on one- or two-year commitments,. Service Preference: While Fiber Optic plans were the most popular, they also represented a critical segment for monitoring due to their higher price points,. Financial Indicators: Churned customers had a higher average monthly charge of $74.44, compared to $61.27 for retained customers. Payment Behavior: The "Electronic Check" payment method was most strongly associated with service cancellation,. 3. Engineering & Preprocessing Pipeline To prepare the data for high-performance modeling, I implemented a rigorous preprocessing workflow: Data Cleaning: Removed irrelevant identifiers like customerID and addressed potential data quality issues. The dataset was verified to have zero missing or NaN values,. Feature Engineering: Applied Label Encoding to transform categorical text variables into a numerical format suitable for machine learning algorithms,. Data Splitting: Adopted a standard 80/20 train-test split to ensure the model could generalize effectively to unseen data,. 4. Model Development & Benchmarking I developed and benchmarked eight distinct machine learning algorithms to identify the most effective solution for this specific application: Linear & Probabilistic: Logistic Regression, Naive Bayes. Tree-Based: Decision Tree, Random Forest. Boosting Frameworks: AdaBoost, Gradient Boosting, XGBoost, and LightGBM,. 5. Performance Evaluation & Results Models were evaluated using ROC curves, confusion matrices, and detailed classification reports,. Winner: Logistic Regression achieved the highest accuracy at 81.83%,. Secondary Performers: Gradient Boosting (81.05%) and AdaBoost (80.98%) also showed strong predictive power. 6. Technical Conclusion This data-driven approach proves that proactive churn prediction is essential for business sustainability. By identifying that customers prioritize high-speed fiber optic services but are sensitive to pricing and contract terms, the company can now optimize its pricing and retention strategies to maximize user satisfaction and revenue.
4
709
10
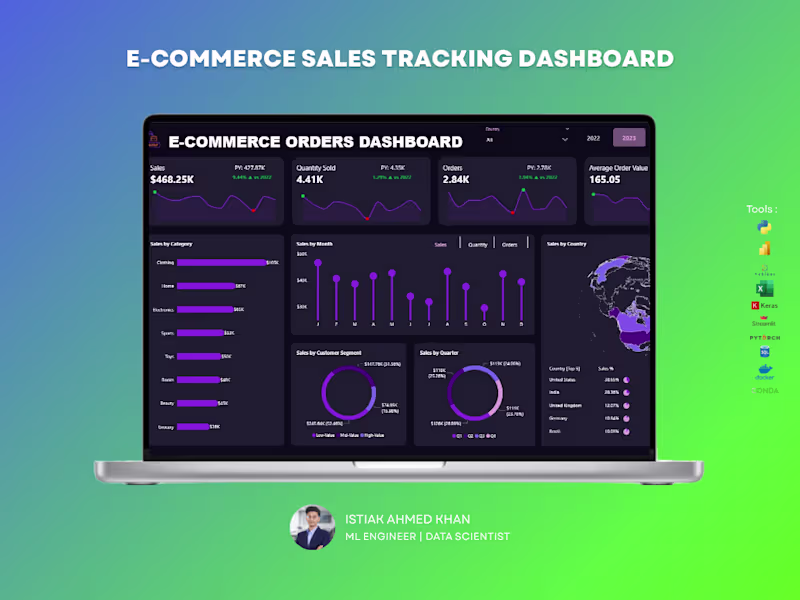
The E-Commerce Orders Dashboard provides a comprehensive overview of order performance, revenue trends, and customer purchasing behavior. Designed for online businesses, this dashboard transforms transactional order data into actionable insights that support growth, operational efficiency, and strategic decision-making.
2
10
1.3K
18
Email Marketing Analytics Dashboard – UI/UX Design Struggling to track campaign performance across multiple channels? This dashboard is designed to give you a complete, real-time view of your marketing efforts in one clean and intuitive interface. A powerful, easy-to-use dashboard that helps you monitor email, SMS, social media, and push campaigns without the confusion of scattered data. Every key metric is presented clearly so you can make faster, smarter decisions. Key Capabilities: Track open rates, click rates, conversions, and revenue in real time, Compare performance across multiple marketing channels, Identify your top-performing campaigns instantly, Understand audience engagement with clear visual breakdowns, Spot trends and optimize campaigns quickly. Most businesses run campaigns but struggle to understand what’s actually working. This dashboard eliminates guesswork by turning your data into clear, actionable insights — helping you improve ROI and scale winning strategies. Perfect For: Digital marketers, E-commerce brands, Agencies managing multiple campaigns, Startups looking to optimize growth. If you want a high-converting, professional dashboard that not only looks great but drives real business decisions — I can help you build it.
8
18
904
6
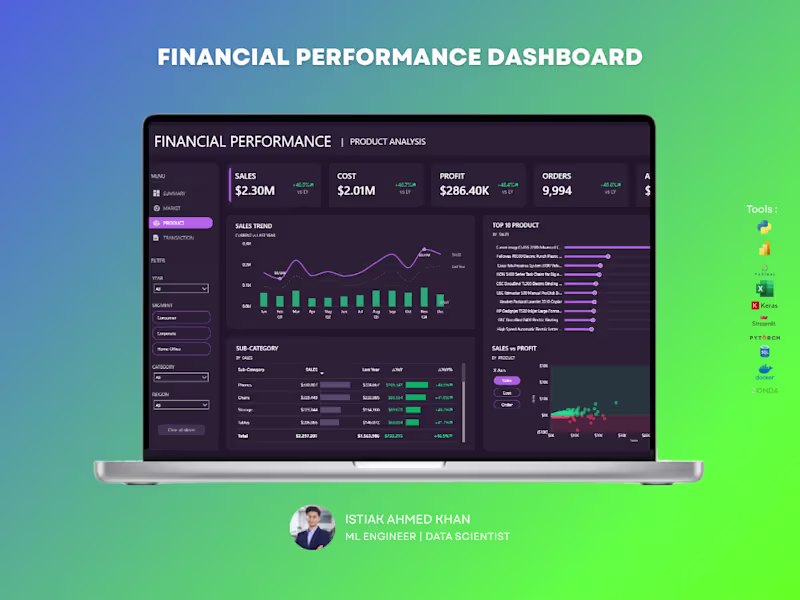
The Financial Performance Dashboard provides a comprehensive overview of an organization’s financial health by tracking revenue, expenses, profitability, and key financial indicators. Built using Power BI, this dashboard enables finance teams and decision-makers to monitor performance, identify trends, and make data-driven strategic decisions.
6
963
Keras
(1)
Follow
Message
Explore people