
Full Stack Dev building websites & data dashboards
Full Stack Dev building websites & data dashboards
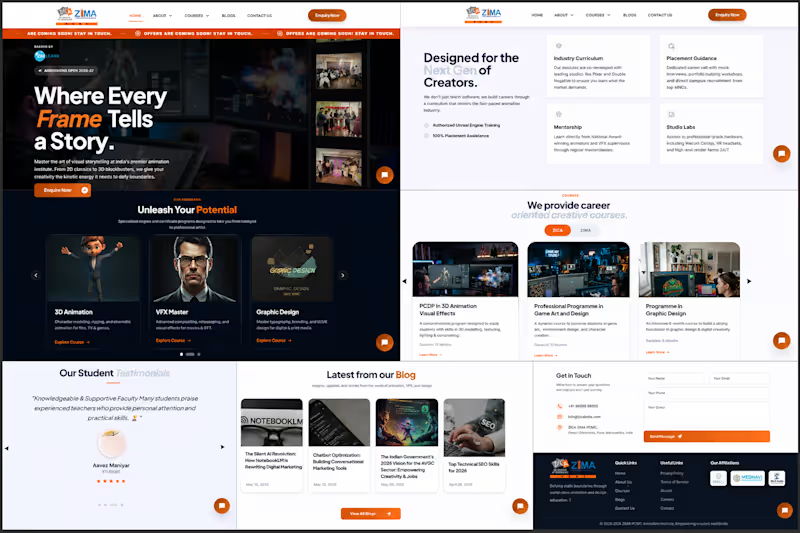


Built a modern and user-friendly website designed to showcase products and improve customer experience.
Focused on clean UI, structured layout, and smooth navigation to help businesses present their services effectively and increase engagement.
Looking forward to collaborating on similar projects 🚀
0
55


JACK OF ALL TRADES...

NEW DESIGN, NEW VIBE
MINIMAL AND BOLD TWO CONRADICTORY DESIGN STYLES IN ONE POSTER
DONE AND DUSTED...
0
20







Excel dashboard specialist turning data to dashboards
- 49
- Followers
Excel dashboard specialist turning data to dashboards

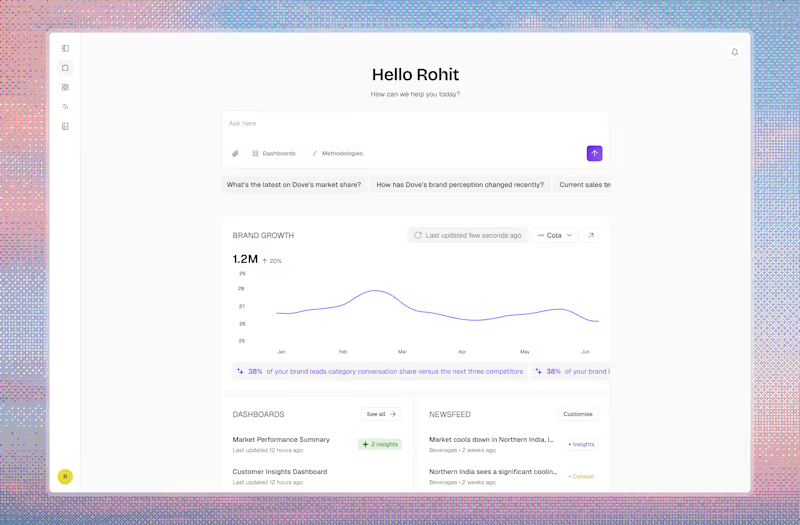
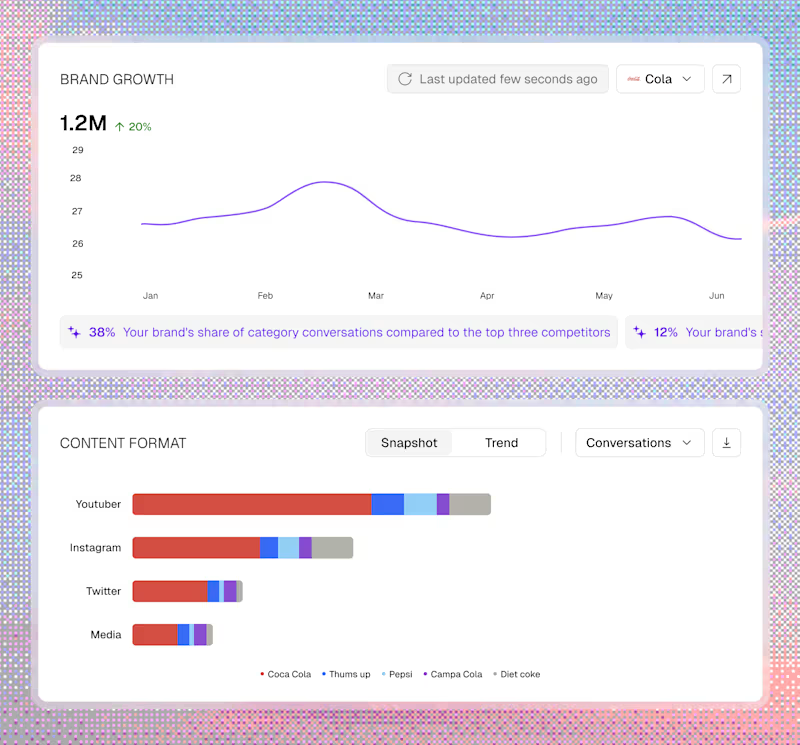
I built this dashboard to transform complex wholesale sales data into actionable intelligence.
This is exactly what it tracks:
→ Executive Snapshot: Key performance indicators (Sales, Orders, Quantity) at the top.
→ Payment Status: A real-time breakdown of outstanding, overdue, paid, and partially paid statuses to monitor cash flow.
→ Salesman Performance: A clean leaderboard to identify top contributors instantly.
→ Trend & Regional Analysis: Monthly sales velocity combined with a regional breakdown to see where the business is doing great.
The raw data behind this was massive, but looking at it would only feel it's chaos.
This dashboard turns it into a 10 second task of understanding everything.
That is the whole point not just to make something look professional, but to make it functional.
P.S. If your business is still reading raw spreadsheet data to make decisions, I would love to show you what a custom dashboard could look like for your specific numbers.
1
2
108


Power BI Expert | Turning Raw Data into Actionable Insights
Power BI Expert | Turning Raw Data into Actionable Insights
Data Analytics Project | BlinkIT Grocery Sales Analysis
Excited to share my latest Data Analytics project ,where I analyzed BlinkIT Grocery Sales Data and delivery data to uncover meaningful business insights 📈
📊 What I worked on:
Analyzed sales performance across product categories, outlet types, sizes, and locations
Identified top-performing item categories and customer preferences
Studied the impact of outlet size, establishment year, and visibility on sales
Converted raw data into actionable insights and business recommendations
💡 Key Insights:
Fruits & Vegetables, Snack Foods, and Frozen Foods drive maximum sales
FOR FULL PROJECT VIST GIT HUB –( https://lnkd.in/d34sdAPz
)
1
91
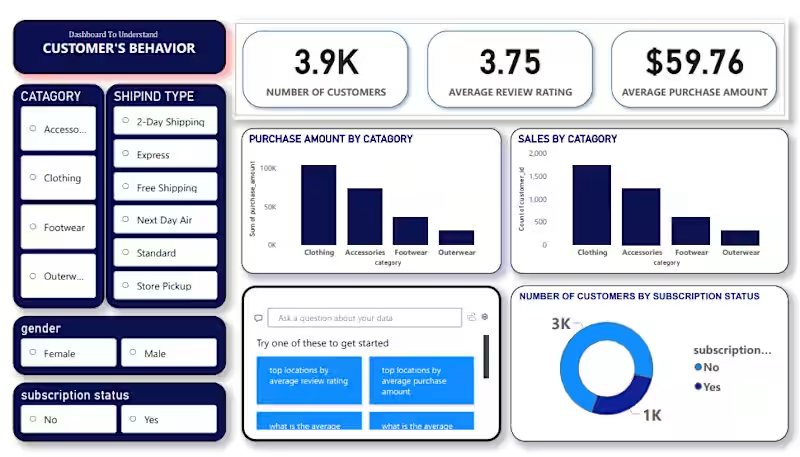
I’m excited to share my latest Data Analytics project where I analyzed Customer Shopping Behavior to uncover trends in sales, demographics, and purchasing habits.This project was a great exercise in building a complete data pipeline.
The Tech Stack:
Python (Pandas & NumPy): Used in Jupyter Notebooks for initial data exploration and statistical analysis.
PostgreSQL: Utilized for rigorous data cleaning, querying, and structuring the dataset for analysis.
Power BI: Built an interactive dashboard to visualize key metrics like seasonal trends, subscription impacts, and category performance.
Project Highlights:
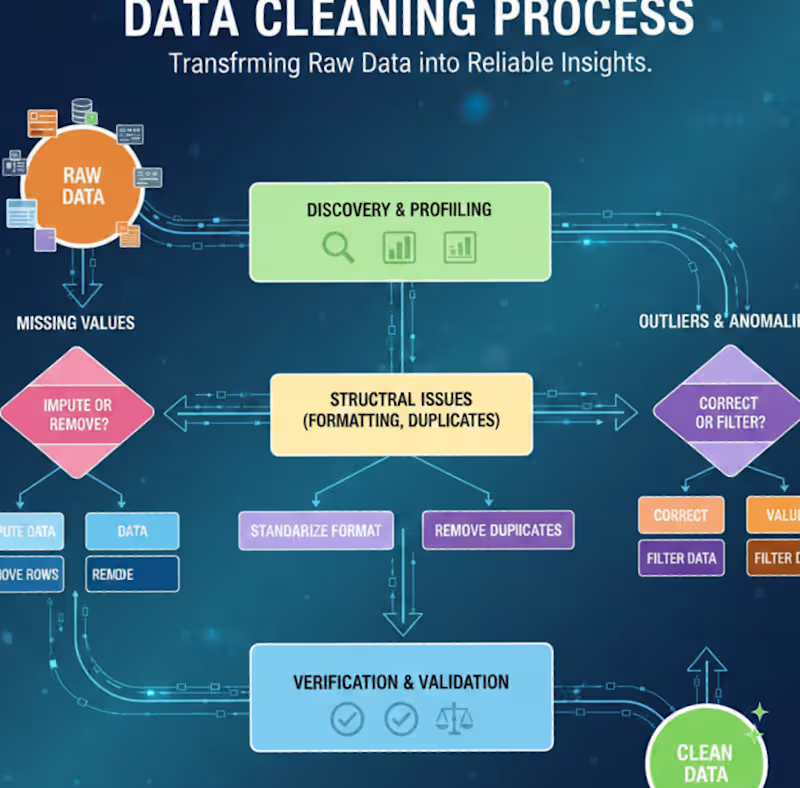
✅ Data Cleaning: Leveraged PostgreSQL and Pandas to handle missing values and standardize categorical data.
1
2
124
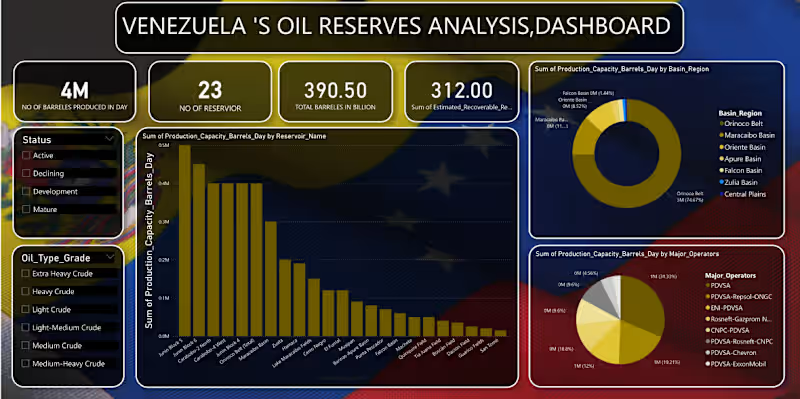
Venezuela’s Oil Reserves Analysis Dashboard 📊
I am excited to share my latest data analytics project focusing on the energy sector. Using a dataset covering 23 reservoirs, I designed a comprehensive dashboard to track production capacity and resource distribution in Venezuela.
Key Features: ✅ Real-time Metrics: Tracking the 390.50 Billion total barrels in reserve. ✅ Granular Analysis: Production capacity breakdown by reservoir name and oil grade (Extra Heavy to Light). ✅ Stakeholder Mapping: Visualizing the production sum by major operators.
Tools Used: [pandas(jupyter notebook)/mysql(for analysis and cleaning of data), Power BI / Excel(for building dashboard)]
I’d love to hear your thoughts or feedback on the dashboard design!
must visit my github for full project -( https://lnkd.in/dYKdZ8J2
)
0
107
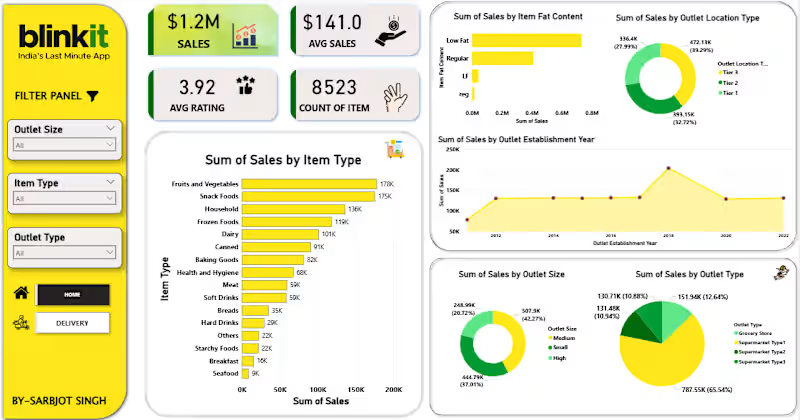
Data Analytics Project | BlinkIT Grocery Sales Analysis
Excited to share my latest Data Analytics project ,where I analyzed BlinkIT Grocery Sales Data and delivery data to uncover meaningful business insights 📈
📊 What I worked on:
Analyzed sales performance across product categories, outlet types, sizes, and locations
Identified top-performing item categories and customer preferences
Studied the impact of outlet size, establishment year, and visibility on sales
Converted raw data into actionable insights and business recommendations
💡 Key Insights:
Fruits & Vegetables, Snack Foods, and Frozen Foods drive maximum sales
Medium-sized outlets outperform others in overall revenue
FOR FULL PROJECT VIST GIT HUB –( https://lnkd.in/d34sdAPz
)
Feedback and suggestions are always welcome!
1
1
121

Delivering Banger Design Projects for Start-ups & SMEs



Expert 3D Product Visualization & Video Production



View more →