Projects using Tableau in BheemunipatnamProjects using Tableau in Bheemunipatnam The Future of the Business Analyst — AI Impact Dashboard
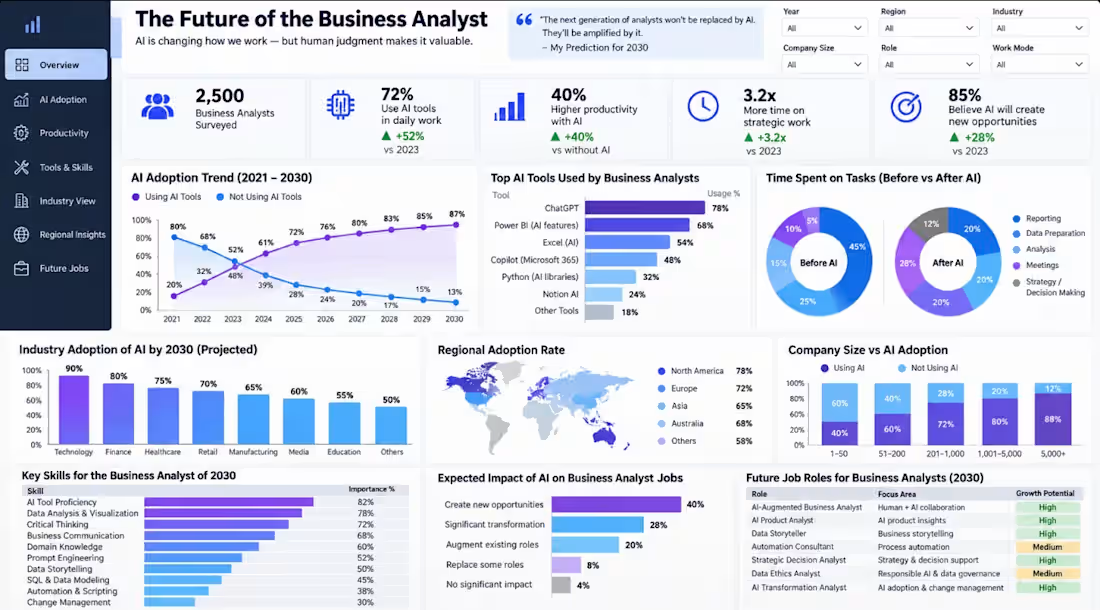
I designed this Power BI dashboard to explore how Artificial Intelligence is reshaping the Business Analyst role and changing where analysts spend their time and create value.
The dashboard brings together AI adoption, productivity impact, AI tool usage, task allocation, industry trends, regional adoption, future skills, and emerging Business Analyst roles into a single decision-focused view.
Key Focus Areas
AI adoption trends and future projections
Productivity improvement through AI
Before vs. after AI task allocation
AI tools used in Business Analysis
Industry and regional adoption patterns
Skills required for the next generation of Business Analysts
Emerging AI-driven roles and opportunities
Business Value
The objective is not simply to visualize AI adoption, but to help organizations understand how AI is changing analyst workflows, where automation can create efficiency, and where human judgment remains critical for strategic decision-making.
Tools & Approach: Power BI • Power Query • Data Modelling • DAX • KPI Development • Data Visualization • Business Insights
Client Note
This dashboard is designed as a flexible business intelligence solution and can be customized using your organization’s actual data, KPIs, departments, regions, workflows, and AI adoption metrics.
From raw data to actionable insights — the focus is on building dashboards that support real business decisions, not just reporting.
❤️ 🛒 E-commerce & Financial Dashboard | Power BI | $2.34M Revenue
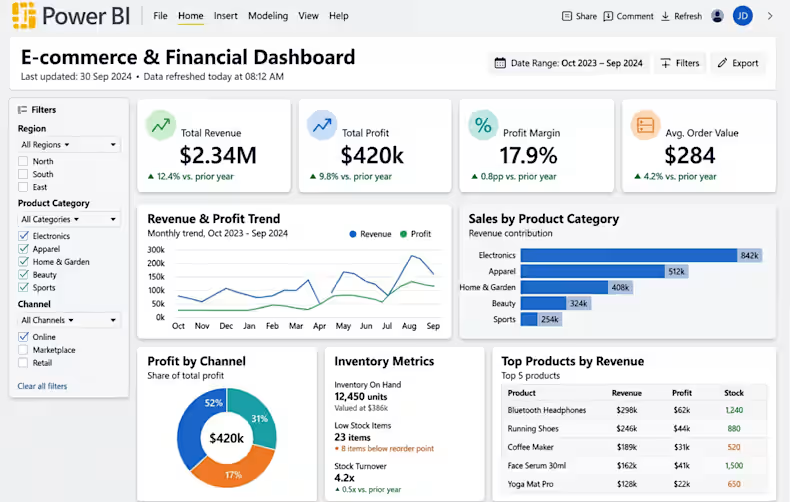
Built an end-to-end E-commerce analytics dashboard to track sales, profit & inventory.
🔹 Problem: Client had no visibility on which products/channels are profitable
🔹 Solution: Built automated dashboard with live inventory alerts
Features Built:
✓ Total Revenue $2.34M (+12.4% YoY), Profit $420K, Margin 17.9%
✓ Revenue & Profit Trend (Oct 2023 - Sep 2024)
✓ Sales by Product Category - Electronics $842K top
✓ Profit by Channel - Online 52% share
✓ Inventory Metrics: 12,450 units, Low stock alert (23 items), Stock Turnover 4.2x
✓ Top 5 Products table with Stock levels
Tools Used: Power BI, DAX, Power Query, Excel, Inventory Management
Result: Client identified best-selling products and reduced out-of-stock by 35%. Automated daily refresh at 06:00 UTC.
This dashboard is used by the Founder daily to take decisions. Title: Power BI Sales Analytics Dashboard
Description:
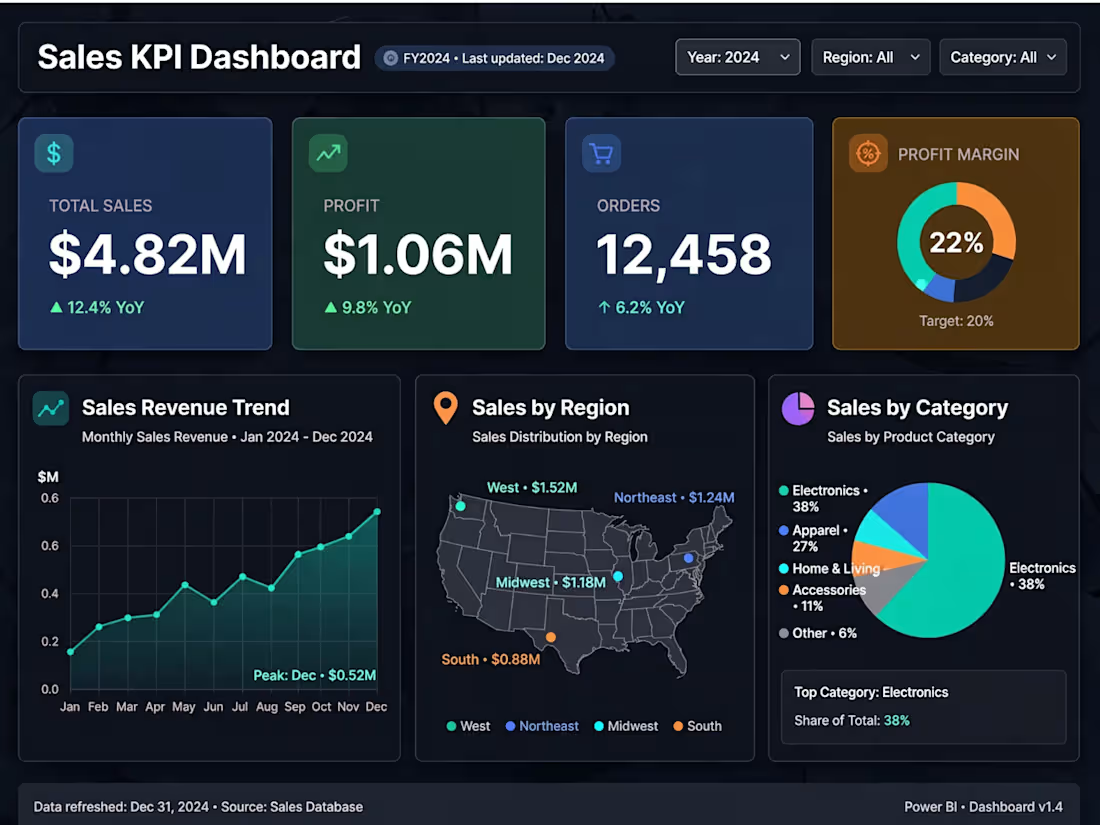
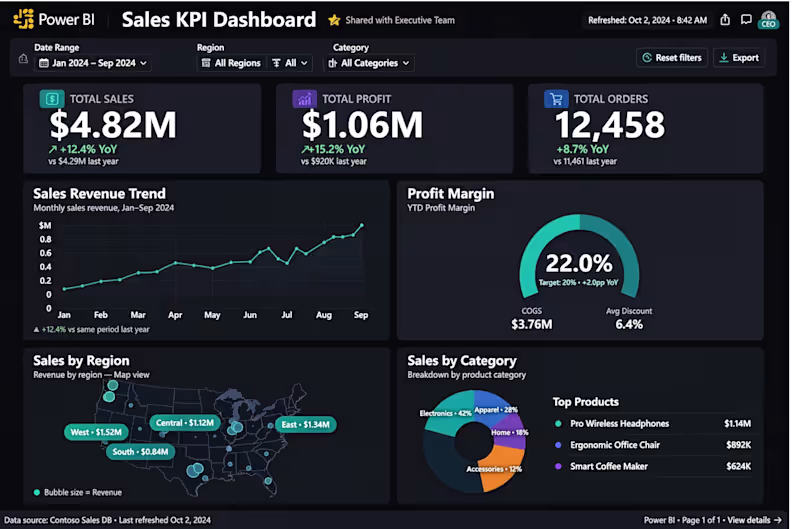
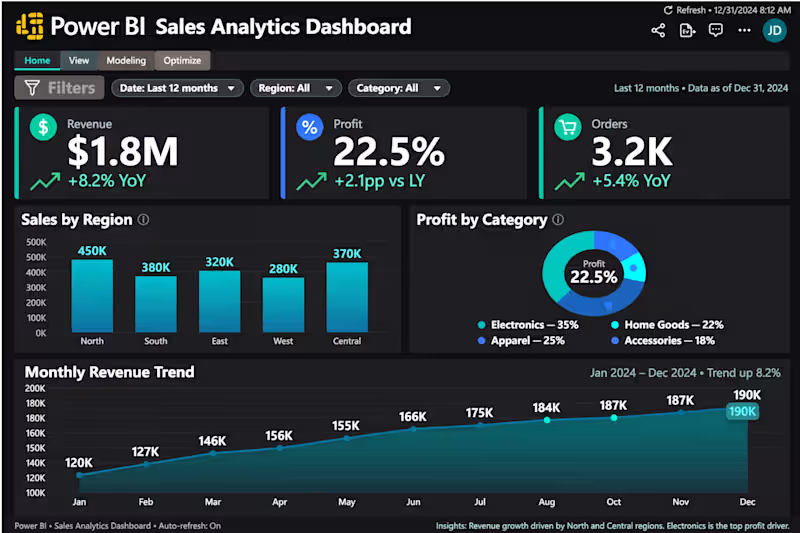
This is a Power BI Sales Analytics Dashboard built to track business performance in real-time.
Key Features:
Revenue Tracking: $1.8M with 8.2% YoY growthProfit Margin Analysis: 22.5% with category-wise breakdownRegional Performance: North & Central regions are top performersMonthly Trend Analysis: Revenue grew from 120K to 190KTools Used: Power BI, DAX, SQL, Excel
Impact: Helped management to identify top-selling categories (Electronics 35%) and focus on high-growth regions.
This dashboard uses interactive filters for Date, Region, and Category to provide actionable insights.Simple ga kavali ante short version:Interactive Power BI dashboard for Sales & Profit analysis. Shows revenue, profit margin, regional sales, and monthly trends. Built with Power BI, DAX, and SQL to help business decisions.