The network for creativity
Join 1.25M professional creatives like you
Connect with clients, get discovered, and run your business 100% commission-free
Creatives on Contra have earned over $150M and we are just getting started
Back to feedPost
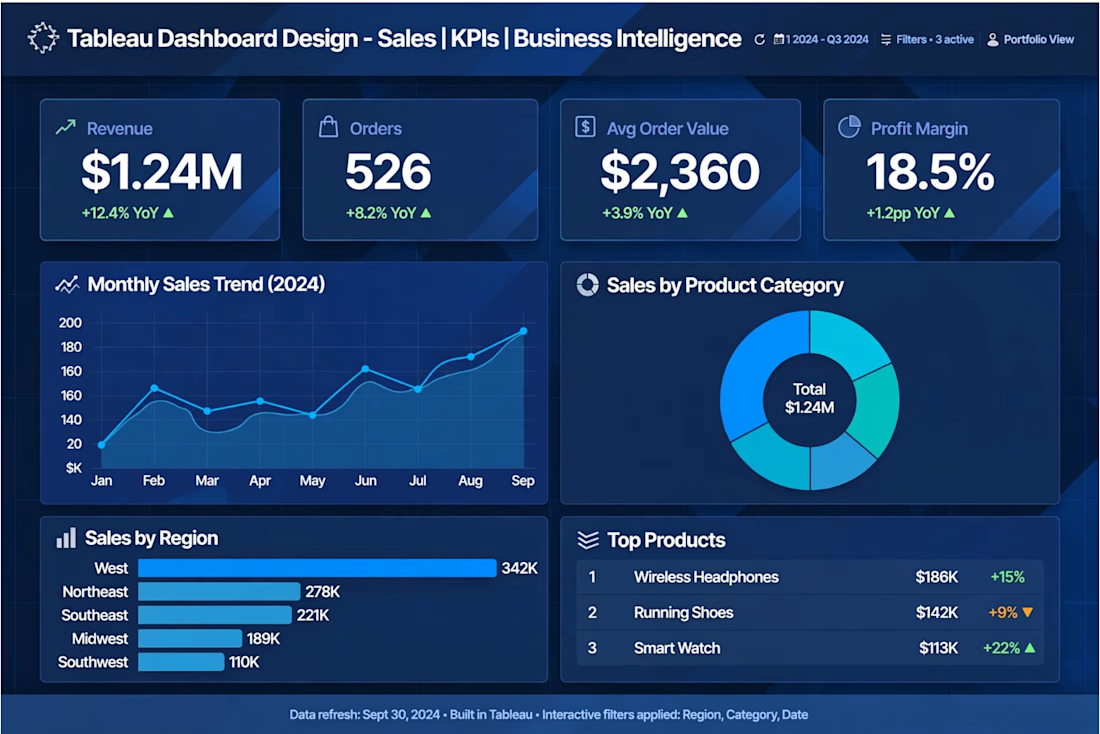
Tableau Sales Dashboard - Business Intelligence Project | Created interactive dashboard to track $1.24M revenue, KPIs, profit margins. 5+ years Tableau expertise.


The network for creativity
Join 1.25M professional creatives like you
Connect with clients, get discovered, and run your business 100% commission-free
Creatives on Contra have earned over $150M and we are just getting started







Related posts

Which dashboard works better for an Occupational therapist?

2 voted
40%
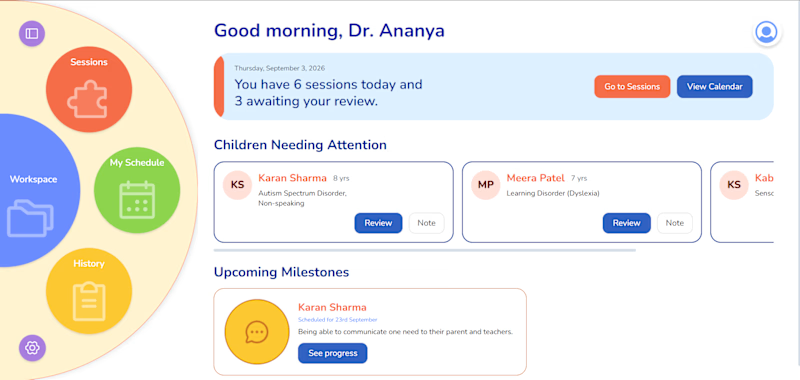
3 voted
60%
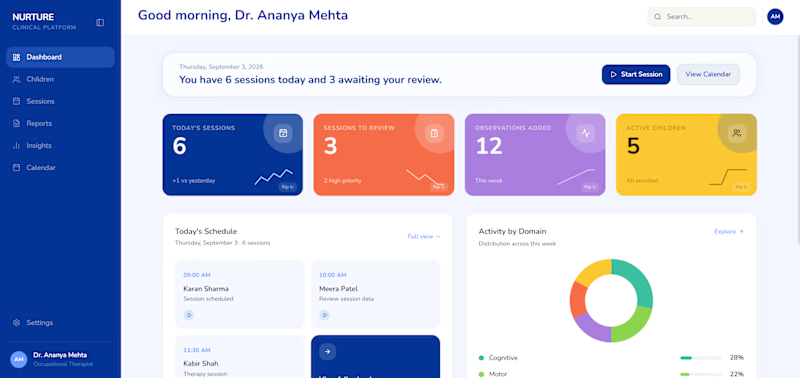
5 votes
Closed

Dashboard should be for how much data can be scanned in the shortest time possible.
Bright Colors are distraction here.

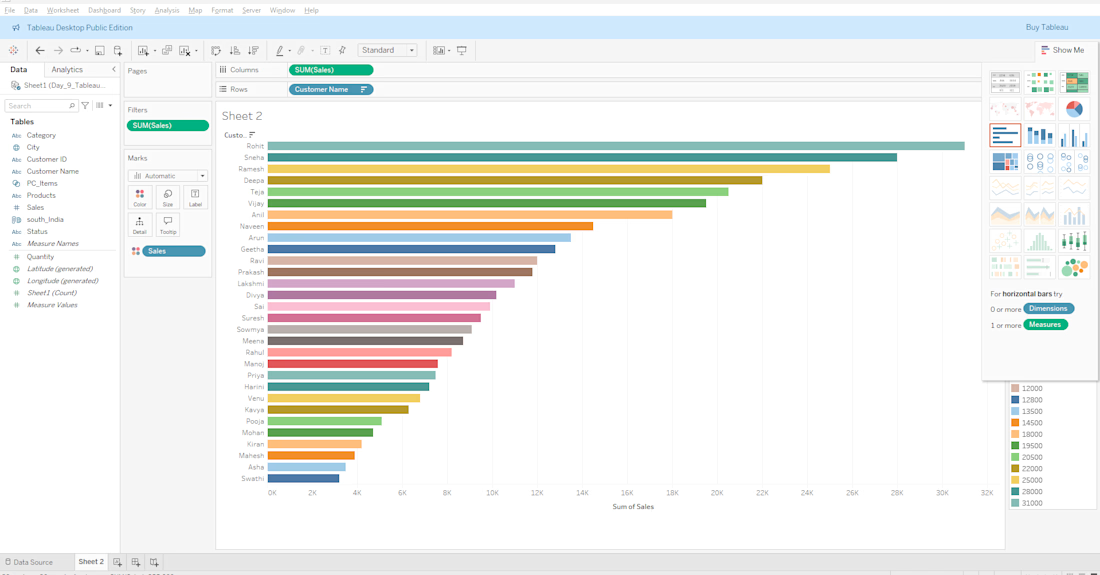
📊 Project: Customer-wise Sales Analysis
What I did:
• Created horizontal bar chart in Tableau to visualize top 30 customers by revenue
• Sorted SUM(Sales) descending to highlight highest revenue drivers
• Identified top performers: Rohit (31K), Sneha (28K), Akhila (26K)
• Applied color differentiation and data labels for clear insights
Tools Used: Tableau Public, Excel, Data Cleaning, Sorting, Aggregation
Outcome: Helps business focus on high-value customers for retention strategy.
Live Dashboard: [Paste your Tableau Public link here if you have]

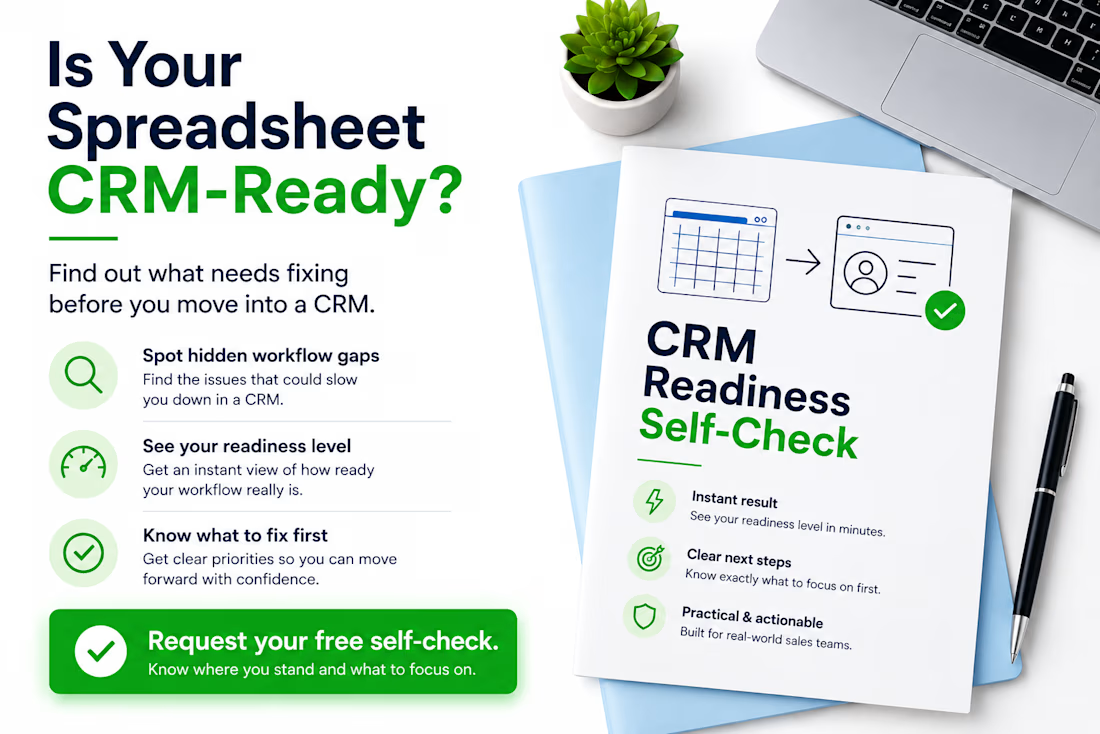
Thinking about moving from Excel or Google Sheets to a CRM? Don’t migrate the problems with the data.
Before choosing or configuring a CRM, I usually check five things:
• Does every active lead have a clear owner?
• Is there always a defined next action?
• Are follow-up dates consistently tracked?
• Are lead statuses clear and used consistently?
• Could another team member understand the spreadsheet without asking for help?
If several answers are “no”, the problem may not be the CRM yet — it may be the workflow behind it.
A CRM works much better when the sales process is clear before migration starts. I created a free CRM Readiness Self-Check for small teams that want to identify these gaps before investing more time or money in a CRM.
If you’re currently working from spreadsheets and considering a CRM, comment “CHECK” or send me a message and I’ll send it to you.
#CRM #CRMReadiness #SalesOperations #RevOps #WorkflowOptimization #GoogleSheets #Excel #BusinessProcess