Power BI Data Analyst + ML AI Automation Expert
- 5.0
- Rating
- 113
- Followers
Power BI Data Analyst + ML AI Automation Expert
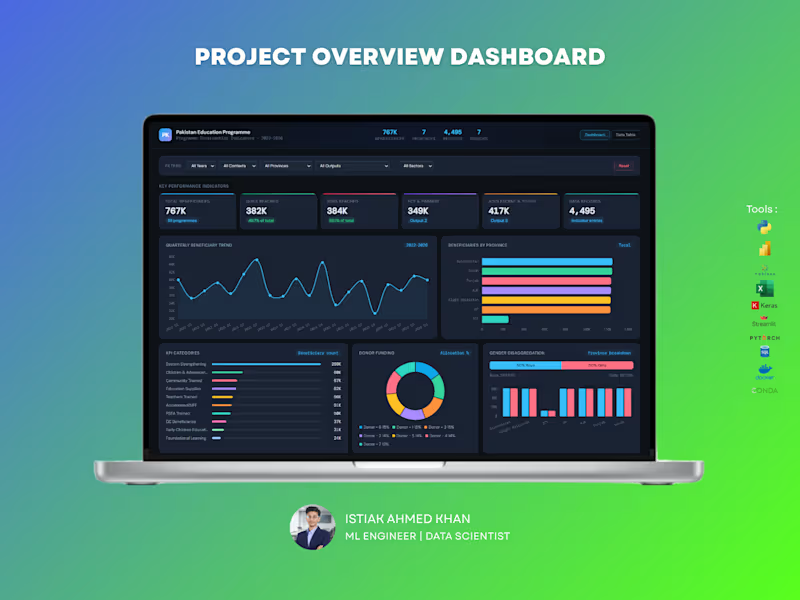
Education Program Analytics Dashboard – Data Analytics Solution
Handling large-scale program data without clear visibility can make impact measurement difficult. This dashboard is designed to give organizations a complete, real-time view of program performance, reach, and funding — all in one place.
What You Get :
A powerful, interactive dashboard that helps track beneficiaries, program outputs, regional performance, and donor contributions with clarity and precision.
Key Capabilities:
Monitor total beneficiaries and gender distribution
Track program reach across provinces and sectors
Analyze quarterly trends and growth patterns
Evaluate donor funding allocation and impact
Identify top-performing program categories and outputs
Explore education level distribution and engagement
For NGOs and large programs, data is critical for decision-making and reporting. This dashboard helps you measure impact, improve transparency, and optimize resource allocation — making your data meaningful and actionable.
Perfect For :
NGOs and non-profit organizations
Government programs
International development agencies
Research and policy teams
If you want a professional, insight-driven dashboard that clearly communicates impact and performance, I can create a customized solution tailored to your organization.
1
451
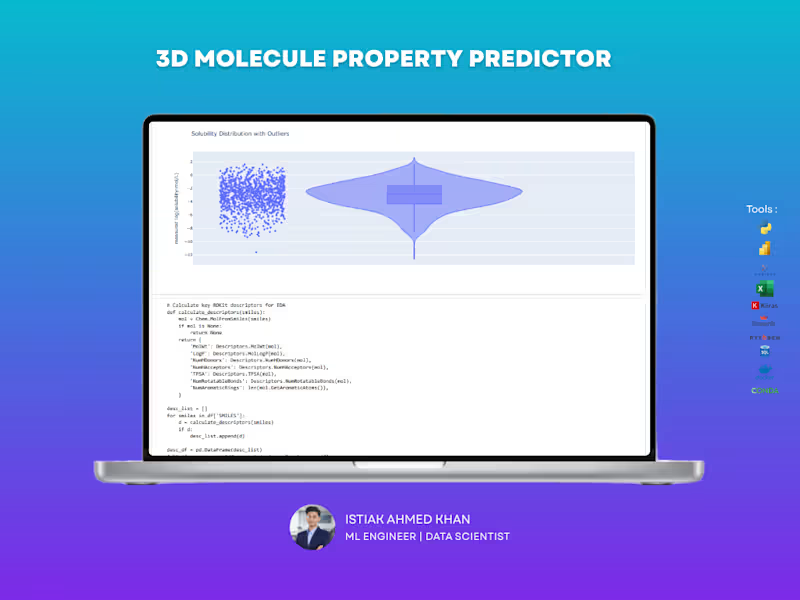
3D Molecular Intelligence: Accelerating Drug Discovery through Predictive Analytics
The Impact: This project addresses a critical bottleneck in pharmaceutical research: determining molecular solubility (logS). By replacing slow, expensive lab tests with high-precision machine learning, this system enables scientists to screen thousands of compounds in seconds, significantly reducing the cost and time required to bring new life-saving drugs to market.
Drastic Cost Reduction: The predictive pipeline reduces early-stage experimental screening costs by 70–90%, allowing research teams to focus resources on the most promising drug candidates.
High-Precision Forecasting: Utilizing a hybrid 3D feature engineering approach, the system achieves a remarkable 91.3% accuracy (R² score) in predicting solubility, providing a highly reliable alternative to physical testing.
Accelerated R&D Cycles: By automating the identification of viable molecules, the tool dramatically shortens the "hit-to-lead" time in pharma and materials science, getting products to market faster.
Empowering Researchers: I deployed a professional Streamlit dashboard featuring an interactive 3D molecular viewer. This allows non-technical chemists to visualize complex structures and make data-driven decisions without needing to write a single line of code
3
365
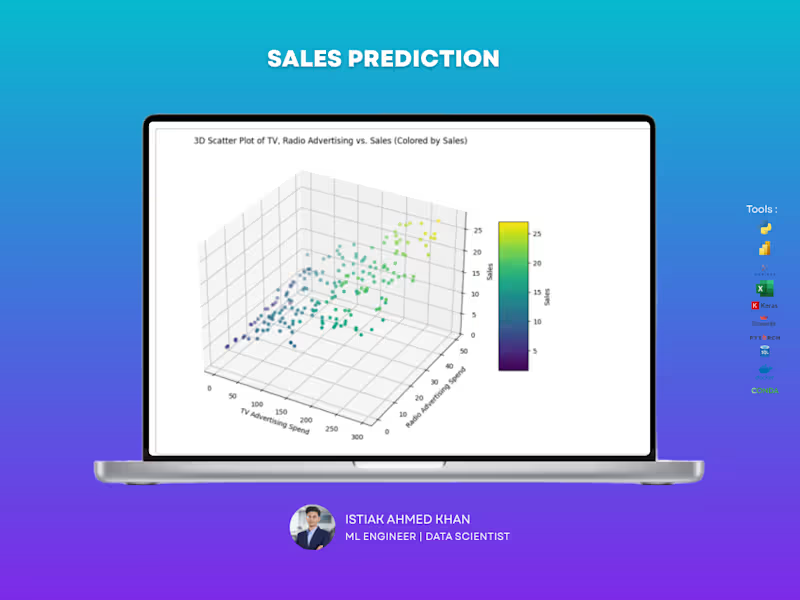
Predictive Marketing Analytics: Optimizing Advertising ROI
1. The Business Problem
Companies often struggle to determine which marketing channels actually drive revenue. Without a data-driven approach, advertising budgets are often misallocated across platforms like TV, Radio, and Newspapers, leading to inefficient spending and missed sales targets. This project aimed to build a predictive model to quantify the relationship between multi-channel marketing spend and total sales.
2. Strategic Insights & Market Analysis
Through a rigorous analysis of historical advertising data, I identified the specific drivers of revenue growth:
Dominant Revenue Driver: TV advertising emerged as the most critical factor, showing a massive 0.9 correlation with sales.
Efficiency Analysis: While Radio and Newspaper spending contributed to the marketing mix, their direct impact on sales was significantly lower (0.35 and 0.16 correlation, respectively), suggesting a need for budget reallocation.
Predictive Power: My analysis revealed that 81.6% of the variance in sales can be explained by TV advertising spend alone, providing a highly reliable foundation for future budget forecasting.
3. Data-Driven Solution
I developed a Linear Regression model to provide leadership with a mathematical framework for sales forecasting.
Reliability: The model was validated using a 70/30 train-test split, ensuring it performs accurately on new, unseen market data.
Accuracy: The system achieved a strong R-squared value of 0.79 on the test set, meaning it can accurately predict nearly 80% of sales fluctuations based on planned marketing spend.
Error Management: I performed a detailed residual analysis to confirm that the model’s error terms were normally distributed, ensuring the reliability of the forecasted figures.
4. Business Impact
Budget Optimization: Provided a clear mathematical equation (Sales=6.948+0.054×TV) that allows the marketing team to calculate the expected return on every dollar spent on TV advertising.
Strategic Planning: Enabled the transition from "gut-feeling" marketing to precision budgeting, allowing the company to maximize ROI by prioritizing high-impact channels.
Risk Mitigation: By identifying the variance that the model couldn't explain, I helped the business identify where external market factors might still influence sales, allowing for more conservative and realistic financial planning.
Technical Stack
Modeling: Simple Linear Regression, Statsmodels (OLS), Scikit-learn.
Analytics: Python, Pandas, NumPy.
Visualization: Seaborn, Matplotlib, 3D Scatter Plots
4
5
764
Sentiment-Driven E-commerce Optimization: Amazon Review Analysis & Rating Prediction.
Project Overview ✅
This project serves as a machine learning proof of concept designed to transform raw Amazon product reviews into actionable business insights. By automating the prediction of review ratings and analyzing customer sentiment, the system enables brands to optimize product listings, proactively address customer pain points, and drive higher conversion rates.
Process ✅
I developed an end-to-end pipeline covering data acquisition, complex text processing, and model deployment. Automated Data Scraping, Integrated the Apify API to extract real-time customer feedback directly from Amazon product URLs. I configured the scraper to handle up to 100 reviews per run, capturing critical metadata including rating scores, review descriptions, and verified purchase status.
Data Refinement & Feature Engineering:
Cleaned a dataset of approximately 1,944 reviews by removing noise (punctuation/symbols) and stop words using NLTK. I implemented TF-IDF Vectorization to convert text into numerical features and applied SMOTE (Synthetic Minority Over-sampling Technique) to address class imbalance, ensuring the model could accurately predict rare negative reviews.
Model Benchmarking ✅
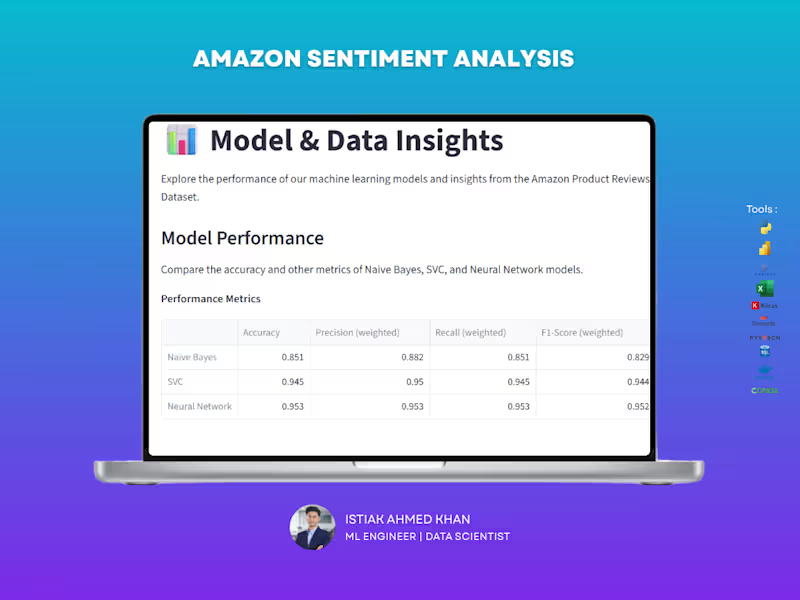
Developed and compared three distinct architectures to identify the most robust predictor:
Naive Bayes: High-speed probabilistic classification.
Support Vector Classifier (SVC): Optimized for high-dimensional text data.
Neural Network (MLPClassifier): To capture complex semantic patterns.
Web App Deployment: Built a dedicated Streamlit dashboard that allows non-technical stakeholders to input raw review text and receive instant rating predictions with confidence scores.
Technical Stack✅
Languages & Tools: Python, Apify Client.
ML & NLP Libraries: Scikit-learn (SVC, Naive Bayes, MLP), NLTK (Tokenization, Stopwords), Imbalanced-learn (SMOTE).
Deployment: Streamlit, Joblib (Model Serialization).
Visualization: Plotly, WordCloud, Matplotlib.
Key Results ✅
Achieved a peak accuracy of 95.27% using the Neural Network model, with the SVC model following closely at 94.46%.
Developed sentiment-based feedback loops within the app: high ratings (4-5 stars) trigger positive marketing recommendations, while low ratings (1-2 stars) alert teams to address product issues like battery life or build quality.
Enabled real-time competitive analysis by providing a user-friendly interface for cross-functional marketing and product development teams to audit customer sentiment at scale.
2
5
795


I will do data analysis and create an interactive dashboard
New to Contra
I will do data analysis and create an interactive dashboard
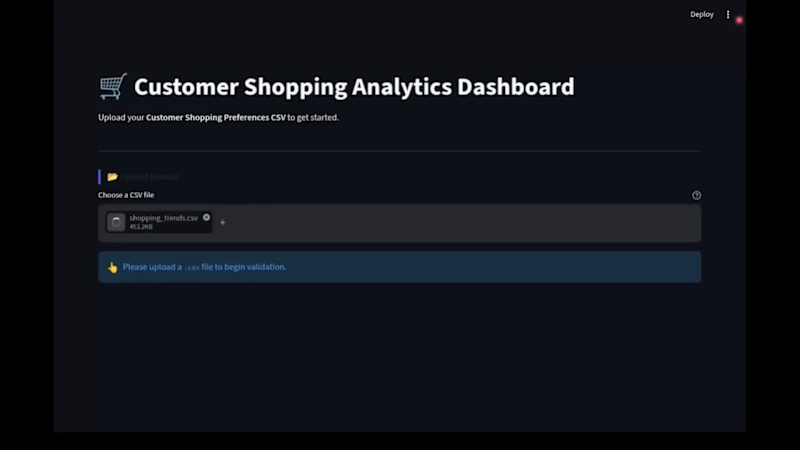
Customer Shopping Insights Dashboard
A fast, user-friendly Streamlit web app designed to turn raw retail data into actionable business insights without any clutter or complexity.
What This Dashboard Does:
Smart File Check: Simply upload your sales CSV file. The app
automatically checks if the file structure, columns, and data types are
correct before processing—ensuring error-free reports.
Instant Executive KPIs: Get a clear overview of Total Revenue, Average
Order Value, Total Customer Count, and Average Review Ratings at
a glance.
Interactive Filtering: Easily filter your data by age, product categories,
shipping methods, or locations using simple sliders and dropdowns.
Table Reports & Visuals: Switch between organized summary tables and
clear interactive charts to see top-performing products, customer age
demographics, location trends, and payment preferences.
Tested & Ready: Pre-tested with Kaggle’s Customer Shopping Preferences
dataset (3,900+ customer records) to ensure seamless handling of real-
world shopping data.
Why It Feels So Fast:
Powered by Polars (an ultra-fast data processing engine built in Rust) instead of standard Python tools, this dashboard handles filtering, sorting, and reporting instantaneously—giving you a smooth, lag-free experience.
Note: Check out the attached screen recording video above to see the interactive upload flow, real-time filtering, and visual reports in action!
0
194
I created a business management project called Donut Shop. It has two main parts: a PostgreSQL database (where all the shop's data is stored) and a Streamlit dashboard (where that data is shown as easy-to-read reports and charts).
Database: I built the database in PostgreSQL because it is fast, reliable and flexible, and it can grow as the shop grows. It is a relational database, which means the tables are connected to each other, so the data always stays organized and consistent. The database has 3 schemas, 25 tables, 32 procedures and 9 triggers.
Schemas (the 3 main sections of the database):
● Inventory: tracks ingredients, donuts, suppliers and stock levels.
● HR: manages employee roles, shifts and salary payments.
● Sales: handles customer data, orders, payments and some ready-made reports.
Tables: The 25 tables work together to manage the whole shop. They cover inventory, suppliers, stock levels, employees, orders, general logs, waste logs, and everything else you would expect a shop to keep track of.
Procedures: A procedure is a ready-made set of steps stored inside the database. All adding, updating and changing of data goes through these 32 procedures. This makes every operation faster and safer. Each procedure checks the data first, handles errors properly, and gives a clear error message if something goes wrong. Because of this, nobody needs to change or insert data into each table by hand.
Triggers: The database has 9 triggers. Think of a trigger like an automatic watchman who is always watching the database. The moment any data is added, updated or deleted, the watchman steps in right away, with no manual click needed. These triggers do very important jobs. For example:
● When a new order item is added, a trigger automatically updates the
stock, so inventory is always accurate.
● When a donut's price changes, a trigger saves the change and updates
the old price to the new one in the donuts table
● When an employee's salary changes, a trigger saves the change in the
salary history table, so every raise or change is recorded.
Dashboard The Streamlit dashboard connects to the database and shows the shop's data as KPIs, tables and charts. The owner can see sales, stock and staff information in one place, without touching the database. Tables can be filtered and downloaded as CSV files, and charts can be saved as images.
Powered by Polars: For data analysis, the dashboard uses Polars instead of the more common pandas library. Polars is a modern, high-performance tool that is faster and handles data more efficiently, so reports and charts load quickly and the dashboard keeps performing well as the shop's data grows. This is one of the key features of this project.
0
201
Donut Shop Interactive Dashboard: Multi-Page Streamlit App
What this is
A multi-page business dashboard that shows a donut shop's sales, inventory and staff data in one place, with clear numbers, tables and charts. The data comes live from a PostgreSQL database, so the owner always sees current information without touching spreadsheets or the database.
4 pages, one simple layout
User Guide: explains how to use the dashboard.
Sale & Revenue: top-selling donuts, sales trends, sales by category, and
profit.
Inventory: purchases, stock, and food waste.
Employees Status: staff by shift, age group and role, plus salary figures.
Every page has the same structure. Key numbers (KPIs) sit at the top, with a Tables tab and a Charts tab below, so new users learn the layout once and can use the whole dashboard.
Refresh button for performance
Instead of reloading constantly in the background, each page has a Refresh button. Users load the latest data only when they need it, which keeps the server and the database light and the dashboard fast.
Filters with select boxes
Tables can be filtered with simple select boxes, for example by month or by employee role. Users get just the rows they want without writing any queries.
Export and share
Charts can be saved as an image with one click.
Tables can be downloaded as a CSV file for Excel or reports.
Fast and interactive
Data is loaded from PostgreSQL with ConnectorX and processed with Polars, which stays fast as the data grows. Results are cached, so repeated views load quickly. Charts are made with Plotly, so you can hover over any point to see its exact values.
Tools: Streamlit, Polars, ConnectorX, Plotly, PostgreSQL, Python
0
203
Donut Shop Sales & Operations Analysis: Polars, Plotly and PostgreSQL
What this is
A data analysis project that turns a donut shop's database into clear, interactive insights about sales, inventory and staff. It reads live data straight from a PostgreSQL database, so the results always match what is happening in the business. There are no manual exports and no copy-pasted spreadsheets.
Why Polars, not the usual pandas
Most data analysis today is done with pandas. For this project I used Polars, a modern, high-performance data library written in Rust. I built the shop's database to scale, and the analysis needed to scale with it.
Fast on big data: Polars uses all of your computer's CPU cores, so it stays fast as the data grows from thousands of rows to millions.
Memory-efficient: it handles large datasets without slowing down or running out of memory.
Built for growth: when the business adds more sales, customers and locations, the analysis keeps working without being rewritten.
Live connection with ConnectorX
The analysis connects to PostgreSQL through ConnectorX, a database connector built for fast loading, and it loads data directly into Polars. Each run pulls the latest data, so a client can refresh the analysis at any time and see current numbers.
Interactive charts with Plotly
All charts are made with Plotly, so they are interactive and not just pictures. Hover over any bar, line or data point to see the exact values, and zoom in or turn data series on and off to explore the details yourself.
What the analysis covers
Sales & revenue: top-selling donuts, sales trends by month, sales by
category, and total profit.
Inventory & waste: ingredient purchases, wasted donuts, and the money
lost to waste.
Staff & operations: employees by shift and age group, and
salary summaries.
Tools: Python, Polars, ConnectorX, Plotly, PostgreSQL
0
206

AI/ML Developer helping businesses solve real-world problems
New to Contra
AI/ML Developer helping businesses solve real-world problems
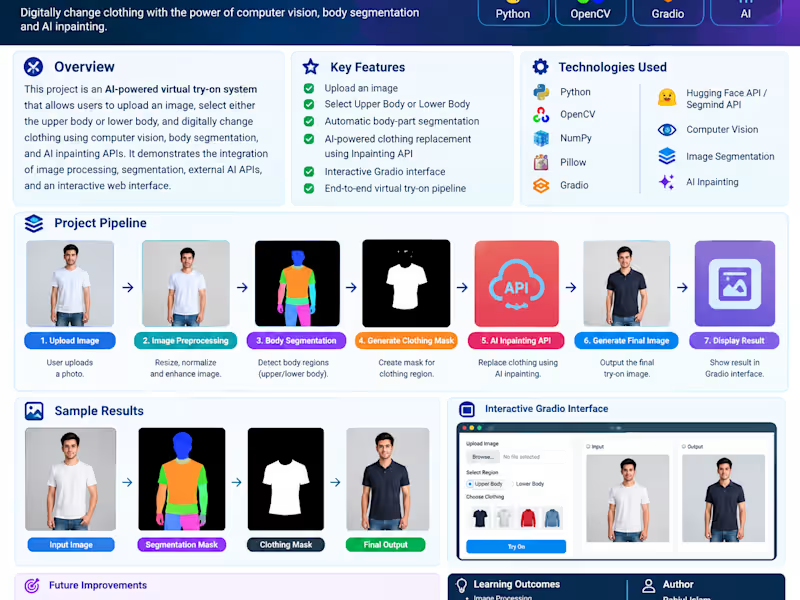
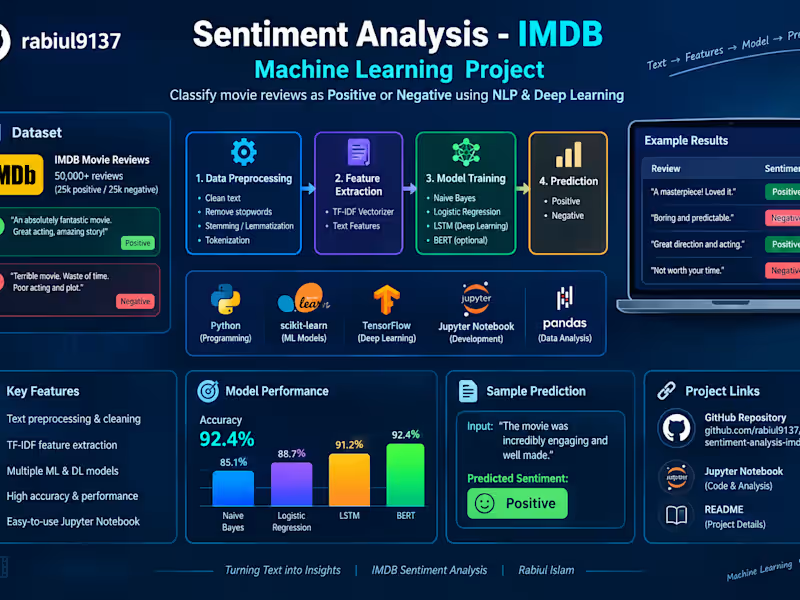

I build AI systems and document them clearly
I build AI systems and document them clearly
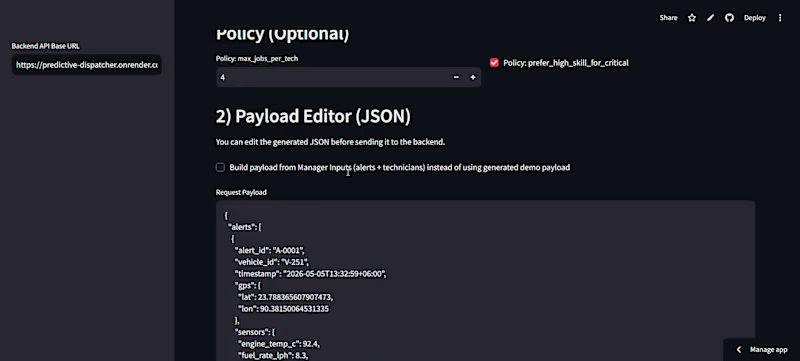
API-Triggered AI Dispatch Automation Pipeline
Built a live automated dispatch system that receives incoming service requests, analyzes them with an LLM, and routes field technicians intelligently, without human triage. The pipeline uses FastAPI as the backend engine, OpenAI for decision logic, and Streamlit for real-time monitoring. Designed and deployed solo from architecture through production. The system is live and publicly accessible.
0
70

Automated Bilingual Document Intelligence System (RAG + LLM)
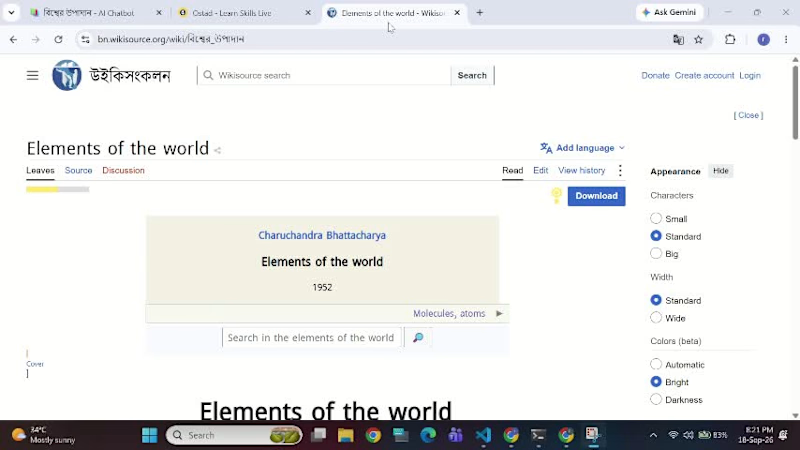
Built a retrieval-augmented generation system that allows users to query a specialized document corpus in both English and Bengali. The pipeline ingests source documents, indexes them with vector embeddings, and returns accurate, context-aware answers via an LLM. Designed for real-world use in water, sanitation, and hygiene (WASH) program contexts. Deployed live on Streamlit Cloud.
0
52

Automated Medical Image Analysis Pipeline with Domain Generalization
Developed a deep learning pipeline that classifies retinal fundus images across multiple disease categories, trained to generalize across unseen datasets using leave-one-domain-out evaluation. Built with PyTorch and deployed as an interactive Streamlit application. Part of active ML research exploring cross-dataset robustness for medical imaging. Combines research-grade methodology with production deployment.
0
60

Automated Semantic Search and Matching Engine (FAISS + SBERT)
Built a semantic product recommendation pipeline using FAISS for vector indexing and Sentence-BERT for generating dense embeddings. The system matches user queries to relevant products based on meaning not just keyword overlap, enabling highly relevant recommendations at scale. Fully deployed and live, demonstrating real-world vector database architecture on a production workload.
0
64

AI Full-Stack Developer | AI SaaS MVP Developer
AI Full-Stack Developer | AI SaaS MVP Developer
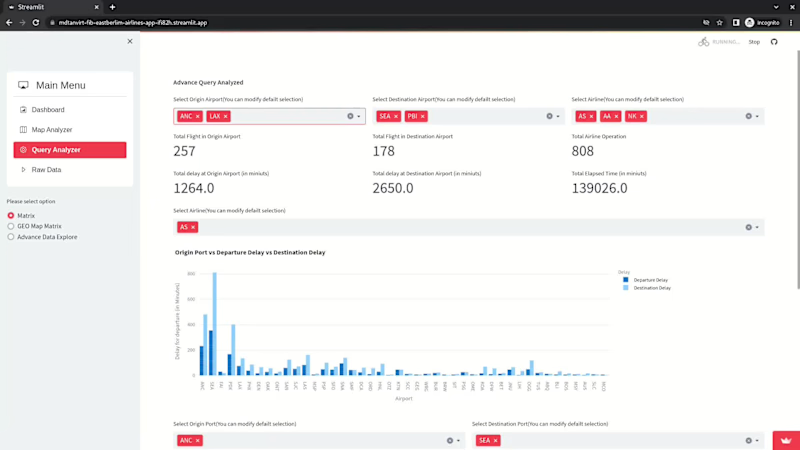

I am representing the demo of two AI powered SaaS applications I have recently developed.
If you want to develop any such AI powered solution, then you can contact me. I will develop your dream AI solution at affordable price. And I assure you about post development service.
So, contact me and share your requirements and get the best service at an affordable price.
2
0
84


Data Analyst