UX-led product design & dev agency for b2b saas and AI

UX-led product design & dev agency for b2b saas and AI
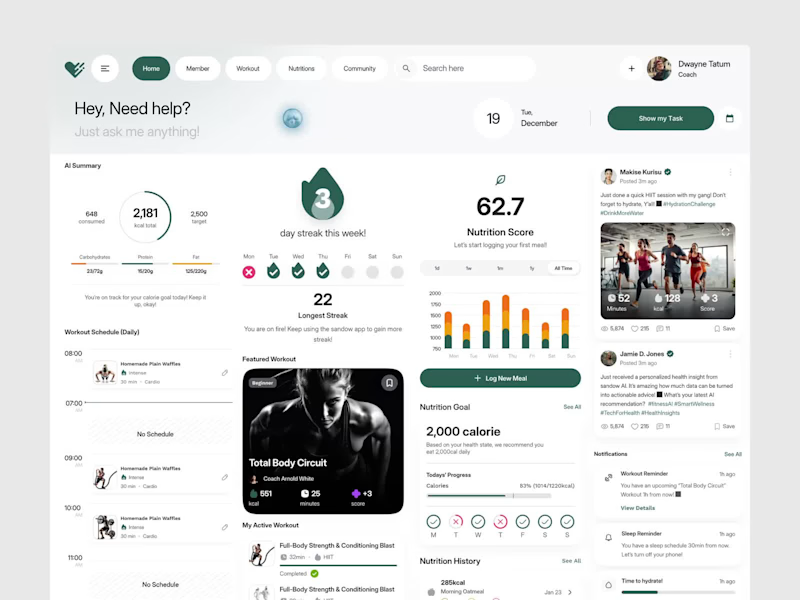
The best fitness tool isn't the one with the most features. It's the one athletes actually open every single morning.
That was the design principle behind this AI-powered fitness dashboard built around the idea that tracking calories, workouts, nutrition, and streaks should feel motivating, not overwhelming.
Most fitness dashboards collect data and nothing else. Athletes, coaches, and health-conscious people deserve better than a generic interface that feels like a spreadsheet with a logo.
This dashboard built the experience to match the motivation.
Deep forest green and clean white canvas. An AI assistant is ready the moment you open it. Calorie progress, streak tracking, nutrition score, featured workouts, daily schedule, and community feed: every section working together as one unified fitness ecosystem.
Workout reminders, sleep reminders, and hydration alerts are all visible without opening a single sub-menu.
Because showing up deserves a tool that makes it feel worth it before the first rep.
What's the one feature most fitness apps completely overlook for real daily use? 👇
0
437
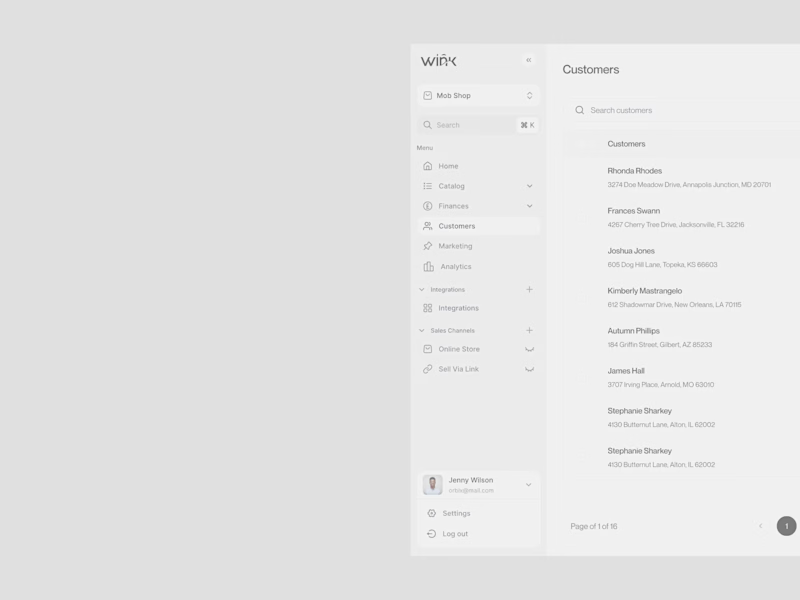
A fashion brand lives and dies by its details. The backend should be no different.
That was the design principle behind the Wink customer management dashboard, a backend experience built with the same monochrome precision as the brand it serves.
Most e-commerce operation tools are designed for utility and nothing else. The team managing real customers, real orders, and real revenue every day deserves better than a generic interface that contradicts everything the brand stands for on the outside.
Wink built the inside to match the outside.
Clean white canvas. Sharp black typography. A sidebar organizing Catalog, Finances, Customers, Marketing, Analytics, and Sales Channels every section exactly where an operations team needs it, nothing they don't.
The customer table says everything: name, location, order count, and total spent. No unnecessary charts. No dashboard bloat. Just precise, scannable data presented the way a premium fashion brand presents everything it touches.
Because operations teams deserve a tool that respects the brand as much as the customer does.
What's the one thing most e-commerce dashboards get completely wrong for fashion brands? 👇
0
434
What if managing crypto portfolios felt as clean as the interface you're looking at right now?
That was the core question behind Finvest, a crypto investment dashboard designed for traders who need BTC, ETH, Dogecoin, and US dollar positions visible, manageable, and actionable from a single screen.
Most crypto dashboards are either overwhelmed with charts or undersell the data that actually drives decisions. The result is a tool traders tolerate rather than trust.
Current balance is visible the moment you open it. Investment portfolios for BTC, ETH, and trending coins with total shares and return rates side by side. Transaction history in progress, Complete across Bitcoin, Dogecoin, Ethereum, US Dollar, and USD Coin all in one scannable table. Fast crypto withdrawals. This week is trending with Dogecoin, Bitcoin, and Ethereum price movements. All inside a clean white dashboard that makes $5,723 feel completely in control.
The lavender-purple brand backdrop, crisp white dashboard canvas, and coin-color iconography do something most fintech tools never attempt: they make a complex multi-asset portfolio feel genuinely manageable.
What's the one dashboard feature most crypto platforms get completely wrong?
0
417
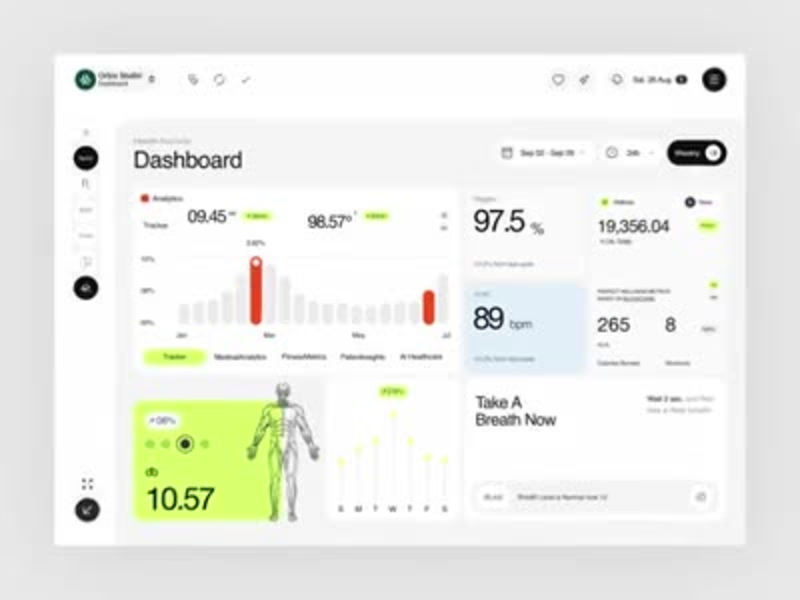
Most health dashboards show you numbers. This one tells you what to do with them right down to "Take A Breath Now."
A modern health records dashboard designed to make medical analytics, fitness metrics, and wellness insights feel clear and genuinely personal. Built for clinicians, coaches, and individuals managing their complete health picture in one workspace.
Designed in Figma with a clean white and neon green interface that keeps complex health data easy to act on. Tracker analytics, oxygen levels, heart rate, calories, workouts, breath coaching, and blockchain-verified wellness metrics all in one calm, readable layout.
The same structure adapts easily for medical SaaS, personal wellness apps, fitness tracking, or AI healthcare products. Every section designed to balance clinical precision with human warmth.
Really happy with how the crisp white canvas, neon green accents, and human anatomy visuals turned complex medical data into something that actually feels good to open every morning.
Would love to hear your thoughts on the UI direction. 👀
UX Design | Health Tech | Dashboard UI | SaaS Platform
Tools: Figma, Jitter
0
473

Power BI Data Analyst + ML AI Automation Expert
- 5.0
- Rating
- 113
- Followers
Power BI Data Analyst + ML AI Automation Expert
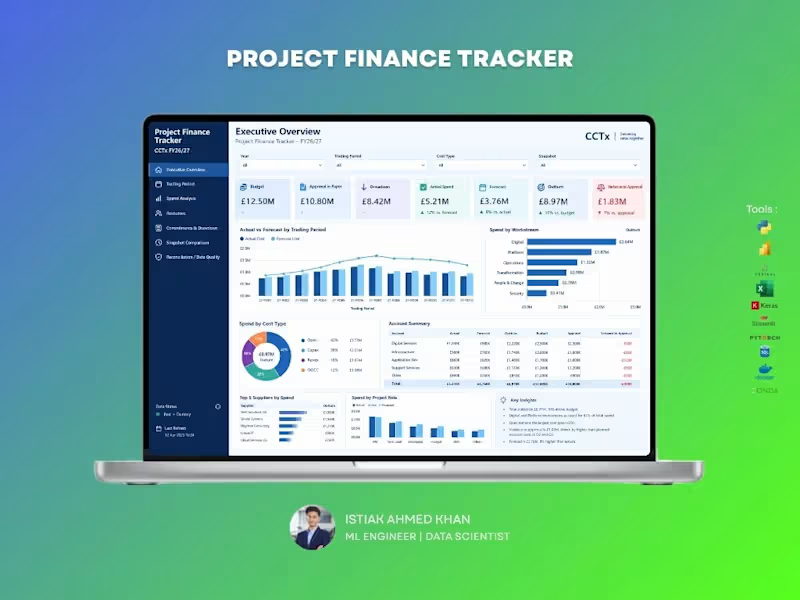
Project Finance Tracker Dashboard
A comprehensive dashboard designed to help project teams monitor budgets, actual spending, forecasts, commitments, and financial variances in one place. Track performance by trading period, cost type, workstream, supplier, and project role. Identify overspending, forecast gaps, and approval requirements early to improve financial control, reporting accuracy, and project decision-making.
1
101
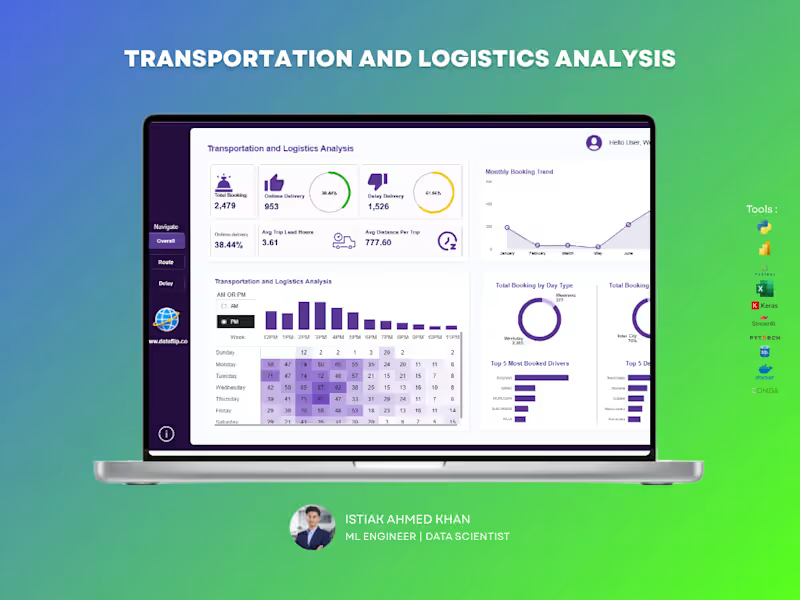
Managing logistics operations without clear insights can lead to delays, inefficiencies, and lost revenue. This dashboard is built to give you complete visibility into your transportation performance — all in one place.
A powerful analytics solution that helps you track bookings, delivery performance, delays, and operational efficiency in real time. Designed for clarity and speed, so you can make decisions without digging through raw data.
🔹Monitor on-time vs delayed deliveries instantly
🔹Track booking trends and operational workload over time
🔹Analyze trip efficiency with lead time and distance metrics
🔹Identify peak hours and demand patterns
🔹Evaluate top drivers and most frequent routes/destinations
🔹Compare weekday vs weekend performance
If you want a clean, professional dashboard that turns your logistics data into real operational insights, I can build a custom solution tailored to your business needs.
2
7
359
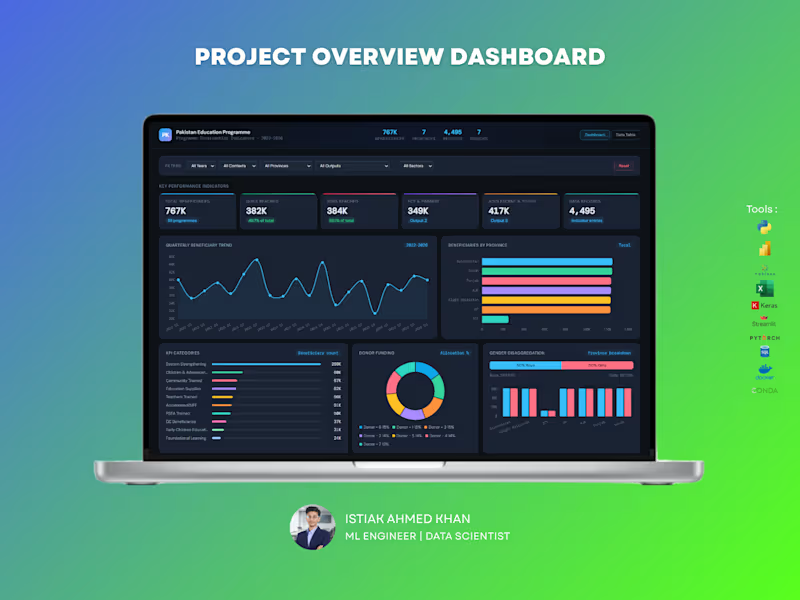
Education Program Analytics Dashboard – Data Analytics Solution
Handling large-scale program data without clear visibility can make impact measurement difficult. This dashboard is designed to give organizations a complete, real-time view of program performance, reach, and funding — all in one place.
What You Get :
A powerful, interactive dashboard that helps track beneficiaries, program outputs, regional performance, and donor contributions with clarity and precision.
Key Capabilities:
Monitor total beneficiaries and gender distribution
Track program reach across provinces and sectors
Analyze quarterly trends and growth patterns
Evaluate donor funding allocation and impact
Identify top-performing program categories and outputs
Explore education level distribution and engagement
For NGOs and large programs, data is critical for decision-making and reporting. This dashboard helps you measure impact, improve transparency, and optimize resource allocation — making your data meaningful and actionable.
Perfect For :
NGOs and non-profit organizations
Government programs
International development agencies
Research and policy teams
If you want a professional, insight-driven dashboard that clearly communicates impact and performance, I can create a customized solution tailored to your organization.
1
452
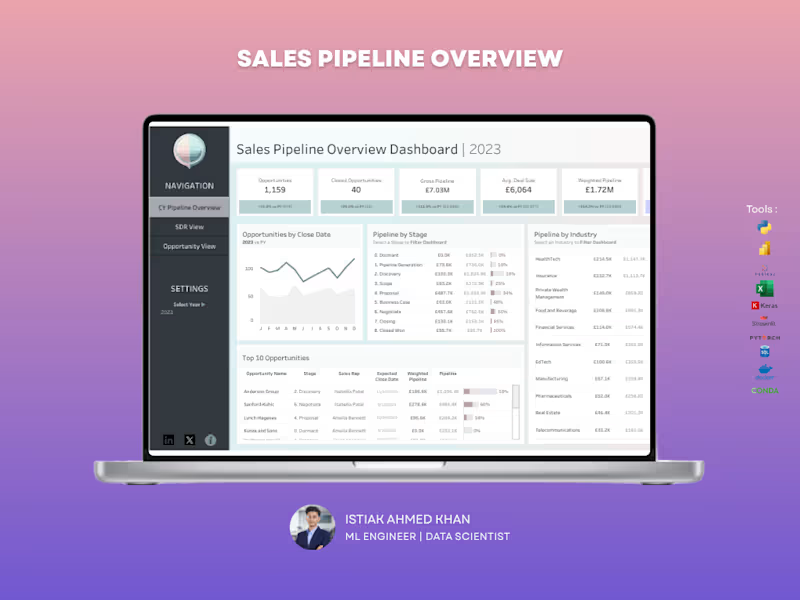
Sales Pipeline Dashboard – Tableau
Struggling to track your sales pipeline and forecast revenue accurately? This dashboard gives you a clear, real-time view of your entire sales funnel, helping you stay on top of opportunities and close deals faster.
What You Get
A centralized Tableau dashboard that brings together pipeline value, deal stages, and performance metrics into one intuitive view. No more scattered reports — everything you need is in one place.
Key Capabilities
Track total opportunities and closed deals
Monitor gross pipeline and weighted pipeline value
Analyze pipeline by sales stage to identify bottlenecks
Compare pipeline performance across industries
View top opportunities and deal progress
Understand average deal size and close trends
Why It Matters
Without visibility into your pipeline, it’s easy to miss opportunities and misjudge forecasts. This dashboard helps you identify stuck deals, improve conversion rates, and predict revenue more accurately.
Perfect For
Sales teams and managers
B2B companies
Startups scaling their sales process
Agencies managing multiple clients
Let’s Build Yours
If you want a high-impact Tableau dashboard that turns your sales data into actionable insights, I can create a custom solution tailored to your business.
4
11
473

UI/UX Designer | Framer and Wix Studio Expert


UI/UX Designer for SaaS, Web & Mobile Products


Rapid Figma UI/UX Design Expert 🚀

I will do data analysis and create an interactive dashboard
New to Contra
I will do data analysis and create an interactive dashboard
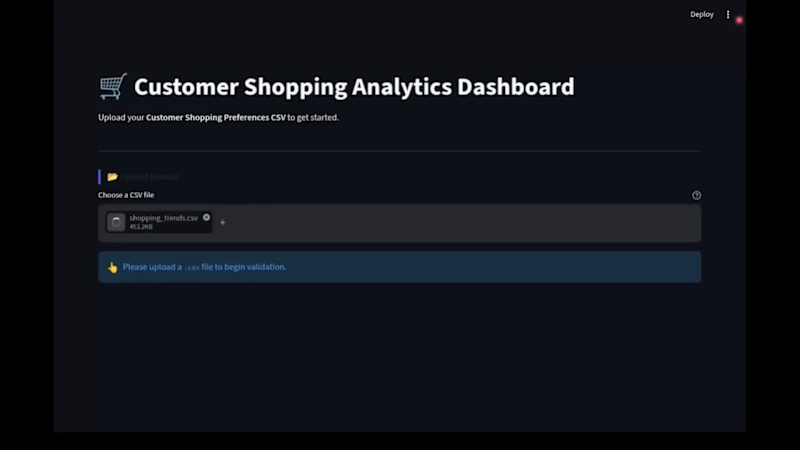
Customer Shopping Insights Dashboard
A fast, user-friendly Streamlit web app designed to turn raw retail data into actionable business insights without any clutter or complexity.
What This Dashboard Does:
Smart File Check: Simply upload your sales CSV file. The app
automatically checks if the file structure, columns, and data types are
correct before processing—ensuring error-free reports.
Instant Executive KPIs: Get a clear overview of Total Revenue, Average
Order Value, Total Customer Count, and Average Review Ratings at
a glance.
Interactive Filtering: Easily filter your data by age, product categories,
shipping methods, or locations using simple sliders and dropdowns.
Table Reports & Visuals: Switch between organized summary tables and
clear interactive charts to see top-performing products, customer age
demographics, location trends, and payment preferences.
Tested & Ready: Pre-tested with Kaggle’s Customer Shopping Preferences
dataset (3,900+ customer records) to ensure seamless handling of real-
world shopping data.
Why It Feels So Fast:
Powered by Polars (an ultra-fast data processing engine built in Rust) instead of standard Python tools, this dashboard handles filtering, sorting, and reporting instantaneously—giving you a smooth, lag-free experience.
Note: Check out the attached screen recording video above to see the interactive upload flow, real-time filtering, and visual reports in action!
0
196
Donut Shop Interactive Dashboard: Multi-Page Streamlit App
What this is
A multi-page business dashboard that shows a donut shop's sales, inventory and staff data in one place, with clear numbers, tables and charts. The data comes live from a PostgreSQL database, so the owner always sees current information without touching spreadsheets or the database.
4 pages, one simple layout
User Guide: explains how to use the dashboard.
Sale & Revenue: top-selling donuts, sales trends, sales by category, and
profit.
Inventory: purchases, stock, and food waste.
Employees Status: staff by shift, age group and role, plus salary figures.
Every page has the same structure. Key numbers (KPIs) sit at the top, with a Tables tab and a Charts tab below, so new users learn the layout once and can use the whole dashboard.
Refresh button for performance
Instead of reloading constantly in the background, each page has a Refresh button. Users load the latest data only when they need it, which keeps the server and the database light and the dashboard fast.
Filters with select boxes
Tables can be filtered with simple select boxes, for example by month or by employee role. Users get just the rows they want without writing any queries.
Export and share
Charts can be saved as an image with one click.
Tables can be downloaded as a CSV file for Excel or reports.
Fast and interactive
Data is loaded from PostgreSQL with ConnectorX and processed with Polars, which stays fast as the data grows. Results are cached, so repeated views load quickly. Charts are made with Plotly, so you can hover over any point to see its exact values.
Tools: Streamlit, Polars, ConnectorX, Plotly, PostgreSQL, Python
0
205
Donut Shop Sales & Operations Analysis: Polars, Plotly and PostgreSQL
What this is
A data analysis project that turns a donut shop's database into clear, interactive insights about sales, inventory and staff. It reads live data straight from a PostgreSQL database, so the results always match what is happening in the business. There are no manual exports and no copy-pasted spreadsheets.
Why Polars, not the usual pandas
Most data analysis today is done with pandas. For this project I used Polars, a modern, high-performance data library written in Rust. I built the shop's database to scale, and the analysis needed to scale with it.
Fast on big data: Polars uses all of your computer's CPU cores, so it stays fast as the data grows from thousands of rows to millions.
Memory-efficient: it handles large datasets without slowing down or running out of memory.
Built for growth: when the business adds more sales, customers and locations, the analysis keeps working without being rewritten.
Live connection with ConnectorX
The analysis connects to PostgreSQL through ConnectorX, a database connector built for fast loading, and it loads data directly into Polars. Each run pulls the latest data, so a client can refresh the analysis at any time and see current numbers.
Interactive charts with Plotly
All charts are made with Plotly, so they are interactive and not just pictures. Hover over any bar, line or data point to see the exact values, and zoom in or turn data series on and off to explore the details yourself.
What the analysis covers
Sales & revenue: top-selling donuts, sales trends by month, sales by
category, and total profit.
Inventory & waste: ingredient purchases, wasted donuts, and the money
lost to waste.
Staff & operations: employees by shift and age group, and
salary summaries.
Tools: Python, Polars, ConnectorX, Plotly, PostgreSQL
0
207
Donut Shop Database: PostgreSQL Design for a Growing Business
What this is
A complete PostgreSQL database that runs a donut shop's daily work: stock, suppliers, staff, customers, orders and payments. It has 3 schemas, 25 tables, 32 procedures and 9 triggers.
Why PostgreSQL
I chose PostgreSQL because it is reliable and scalable. If the business gets bigger, with more customers, orders and staff, the database keeps working smoothly and doesn't need to be rebuilt.
How it is organized
The database is split into 3 sections (schemas), so everything has a clear place:
Inventory: donuts, ingredients, suppliers, purchases, stock levels, discounts, waste, and price history.
HR: employee roles, shifts, salaries, and payment history.
Sales: customers, orders, payments, and canceled items.
All the tables are connected, so the data stays consistent. There are also 4 ready-made reports (views), such as daily sales, sales by donut, and canceled items.
Procedures: ready-made, safe operations
Every change to the data goes through one of 32 stored procedures, such as record_items, record_payment and cancel_sale. Each procedure checks the data first and gives a clear error message if something is wrong, for example a negative price, a donut that doesn't exist, or an order bigger than the stock.
I built it this way for speed and safety. Running operations directly from Python is slower, so my Python functions call these procedures instead. The work then runs inside the database in a single call, and the application never writes to the tables directly. In my testing, this was really fast.
Triggers: the automatic watchmen
9 triggers react the moment data changes, with no extra code needed:
A new order item is added: the donut stock goes down automatically and the change is logged.
A donut or ingredient price changes: the old and new prices are saved in a history table.
An employee's salary or shift changes: the change is saved in a history table.
Stock gets low: a warning is created for donuts at 10 or fewer and for ingredients below their minimum level.
New ingredients are purchased: the stock level is updated automatically.
Built with data analysis in mind
Customers and employees are never deleted, only marked inactive, so history is kept. Together with the price, salary, waste and inventory logs, this gives clean data for reports, forecasting and dashboards.
Tools: PostgreSQL, PL/pgSQL, Python
0
210

20+ Founders trust me for AI Product, AI UX & Agentic UX. ⚡
- 11
- Followers
20+ Founders trust me for AI Product, AI UX & Agentic UX. ⚡