
Data Analyst & Computer Engineer | Power BI & SQL Expert
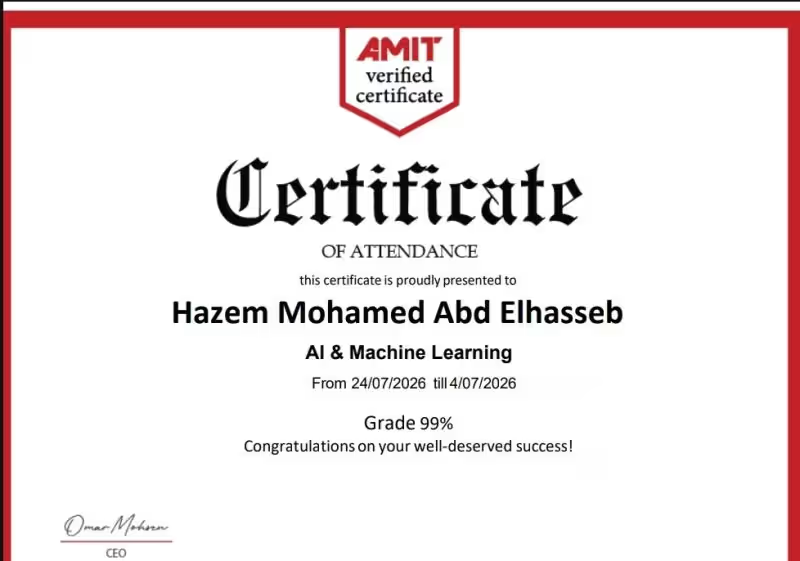
Excited to share a new milestone!
I’m thrilled to announce that I have successfully completed the AI & Machine Learning track at AMIT Learning (https://www.linkedin.com/company/amit-learning/) with a grade of 99%! ✨️
Throughout this journey, I’ve focused on bridging the gap between theoretical knowledge and real-world application, applying these concepts directly to hands-on projects like my current Traffic Congestion Analysis using Python, Pandas, and advanced data cleaning techniques.
A big thank you to Maria Roshdy (https://www.linkedin.com/in/maria-roshdy-3b3000234/) and the entire team at AMIT Learning (https://www.linkedin.com/company/amit-learning/) for the valuable guidance and great learning experience. Looking forward to the next steps into predictive modeling and AI solutions!
#ArtificialIntelligence (https://www.linkedin.com/search/results/all/?keywords=%23artificialintelligence&origin=HASH_TAG_FROM_FEED) #MachineLearning (https://www.linkedin.com/search/results/all/?keywords=%23machinelearning&origin=HASH_TAG_FROM_FEED) #DataScience (https://www.linkedin.com/search/results/all/?keywords=%23datascience&origin=HASH_TAG_FROM_FEED) #AMIT (https://www.linkedin.com/search/results/all/?keywords=%23amit&origin=HASH_TAG_FROM_FEED) #Python (https://www.linkedin.com/search/results/all/?keywords=%23python&origin=HASH_TAG_FROM_FEED) #DataAnalytics (https://www.linkedin.com/search/results/all/?keywords=%23dataanalytics&origin=HASH_TAG_FROM_FEED)
0
166
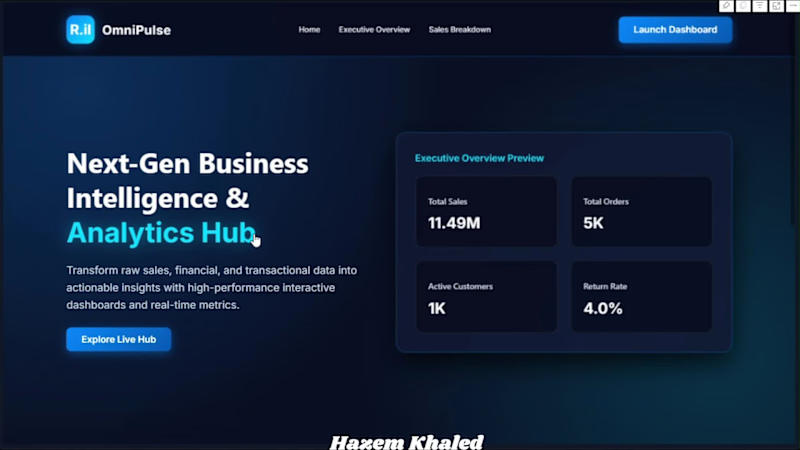
This might be the project that took the most time and effort to bring to a final finish line, but the result is truly worth it.
I am thrilled and excited to share with you OmniPulse Analytics Hub, an end-to-end Business Intelligence project I’ve been working on.
The idea wasn't just about putting a few charts together; the real challenge was deep in the backend and setting up a solid data model: linking 18 tables, building a proper Star Schema, and writing custom DAX measures to deliver accurate, error-free KPIs.
In this project, I focused on:
• Professional data cleaning and preprocessing.
• Table relationships and implementing Time-Intelligence using a dedicated DimDate table.
• Developing advanced DAX measures to analyze sales trends, return rates, and inventory levels.
• Designing a clean and intuitive user interface enabling management to read the numbers and make instant decisions.
• Integrating a one-click Executive Summary providing a complete project overview, key metrics, and dashboard status for immediate decision-making.
The dashboard features two main sections:
📌 Executive Overview (Comprehensive view of revenue, total sales, and overall performance rates)
📌 Category & Sales Breakdown (In-depth category analysis and low-stock tracking)
The biggest takeaway from working on this project: A massive amount of disorganized data is worthless. The true art lies in turning a mess of numbers into a clear, actionable story.
I'd love to hear your thoughts and welcome any feedback or suggestions! 👇
#PowerBI #DataAnalytics #BusinessIntelligence #PowerQuery #DAX #DashboardDesign #DataVisualization #DataModeling #Retail #DataScience
2
254
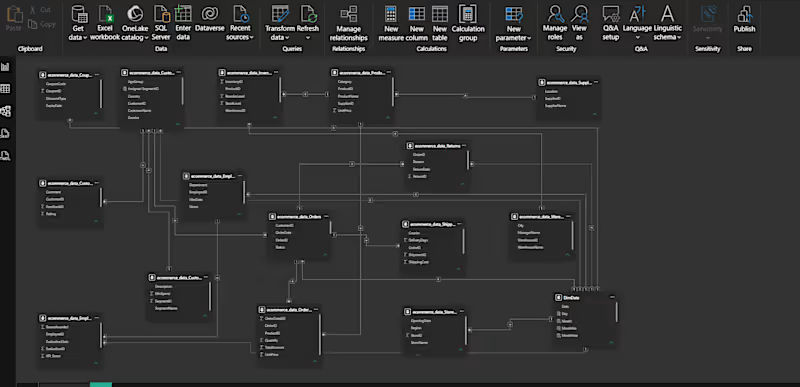
Here is a professional English translation of your post that captures the exact same message and tone:
Just wrapped up the project, and I realized this is definitely the picture worth sharing the most! 😁
Sometimes people look at the final dashboard and think that’s where all the work happens, but the real magic starts right here... the Data Model.
Behind every single relationship here is a lot of thinking, testing, and tweaking until everything finally clicked into place.
Alhamdulillah, the project is officially complete, and I’ve learned way more from it than I initially expected.
Any feedback is more than welcome! 🙏
#PowerBI #DataAnalytics #PowerBIDeveloper #Portfolio #OpenToWork
2
4
441
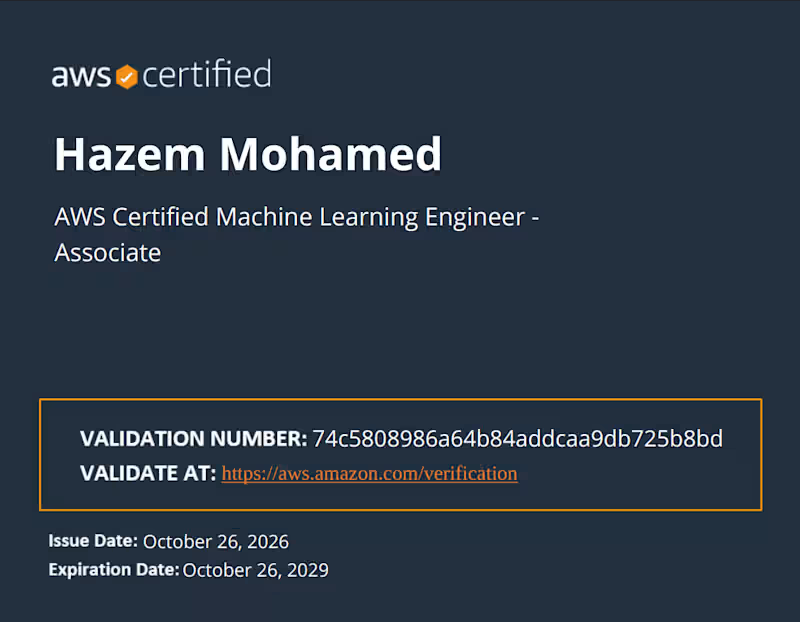
Proud to officially add the AWS Certified Machine Learning Engineer - Associate certification to my toolkit!
Building robust machine learning pipelines and scaling AI workloads securely on the cloud has always been a key focus of mine. Earning this certification has been a great deep-dive into mastering AWS ML infrastructure, MLOps best practices, and production-grade architectures.
Ready to bring these advanced capabilities to upcoming data science and engineering projects! Let's build something impactful. 💡💪
🔗 Verify Certificate:
Validation Number: 74c5808986a64b84addcaa9db725b8bd
Verification Link: https://aws.amazon.com/verification
#AWS #MachineLearning #AI #CloudComputing #DataAnalysis #MLOps
4
5
780

I can answer your data questions
I can answer your data questions


Backend Engineer | APIs, Data Pipelines & AI

Designed and built a configurable Python engine for generating large, realistic relational datasets with preserved primary-key and foreign-key relationships. The system supports reusable business templates, weighted distributions, multiple ID strategies, and scalable generation across related tables. Performance work increased throughput to more than 300,000 rows per second in large benchmark runs. The project is being extended with dirty-data injection, validation reports, and additional output formats.
0
28

Analyzed approximately 600,000 column headers across a large collection of Google Sheets to identify recurring data fields, naming inconsistencies, and common schema patterns. Built an automated extraction and analysis workflow to process the spreadsheets at scale, normalize similar headers, group related fields, and surface the data structures most frequently requested across projects. The findings were used to support schema standardization and improve consistency in future data collection workflows.
0
31

Designed and built an AI-assisted research system that automates the process of locating, prioritizing, and extracting information from websites. The system crawls relevant pages, retrieves the most useful content, and uses Retrieval-Augmented Generation (RAG) to answer user questions with supporting quotations and source references. Built with a modular architecture to support multiple research tasks while minimizing unnecessary crawling and reducing manual research effort.
0
38

Designed and built an end-to-end data collection pipeline used by a distributed team. A custom browser extension captured structured data during normal workflows and sent it to a FastAPI service for validation, transformation, and centralized processing before storage in PostgreSQL on AWS RDS. The system replaced a manual collection step, handled roughly 5,000 records per day, and was designed for reliable API communication, maintainability, and future expansion.
0
38

BI & Analytics Engineer | E-Commerce & Automation Specialist
BI & Analytics Engineer | E-Commerce & Automation Specialist


View more →

Excel & Power BI turn data into insights and dashboards.


KPI insights & dashboards that drive efficiency
KPI insights & dashboards that drive efficiency

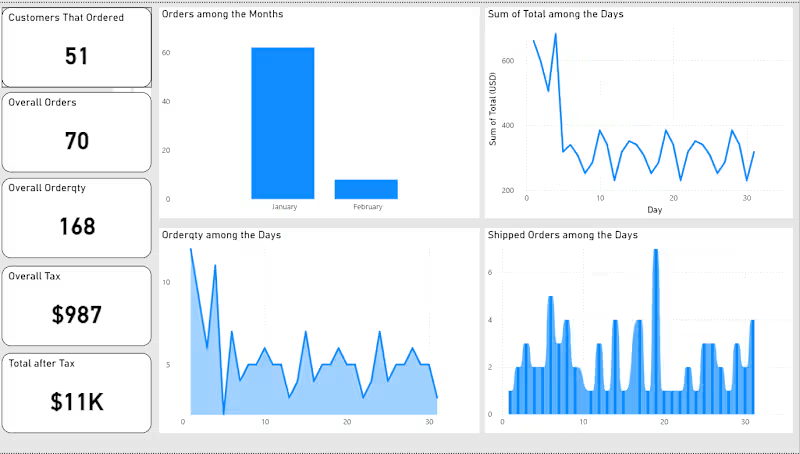
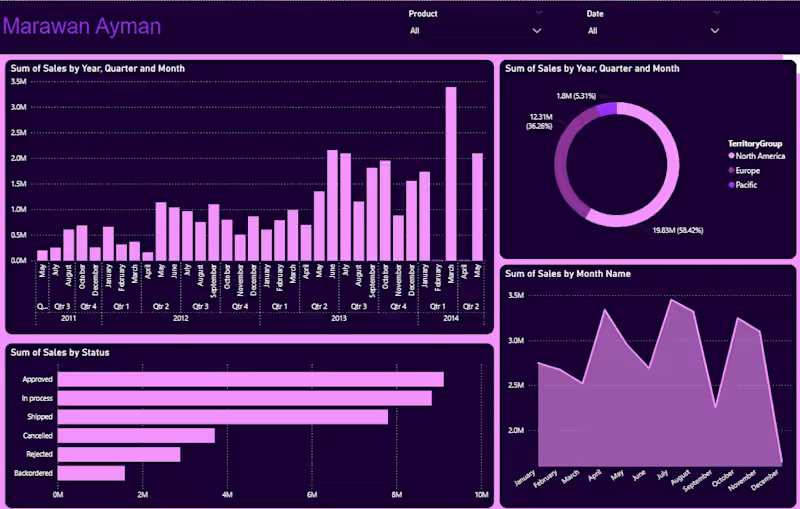
The project delivered a professional, multi-panel dashboard with line graphs, bar charts, and pie charts, enabling stakeholders to quickly assess growth, customer behavior, and operational efficiency. This visualization improved decision-making by providing clarity on sales performance, customer activity, and revenue consistency.
0
84




Python Data Analyst for Hire
Python Data Analyst for Hire


View more →