Projects using Tableau in Agege
Projects using Tableau in Agege
Sign Up
Post a job
Sign Up
Log In
Filters
2
Projects
People
Message
0
Adeyi Olamide
pro
Vyralix
0
4
Message
3
Victor Ogunyemi
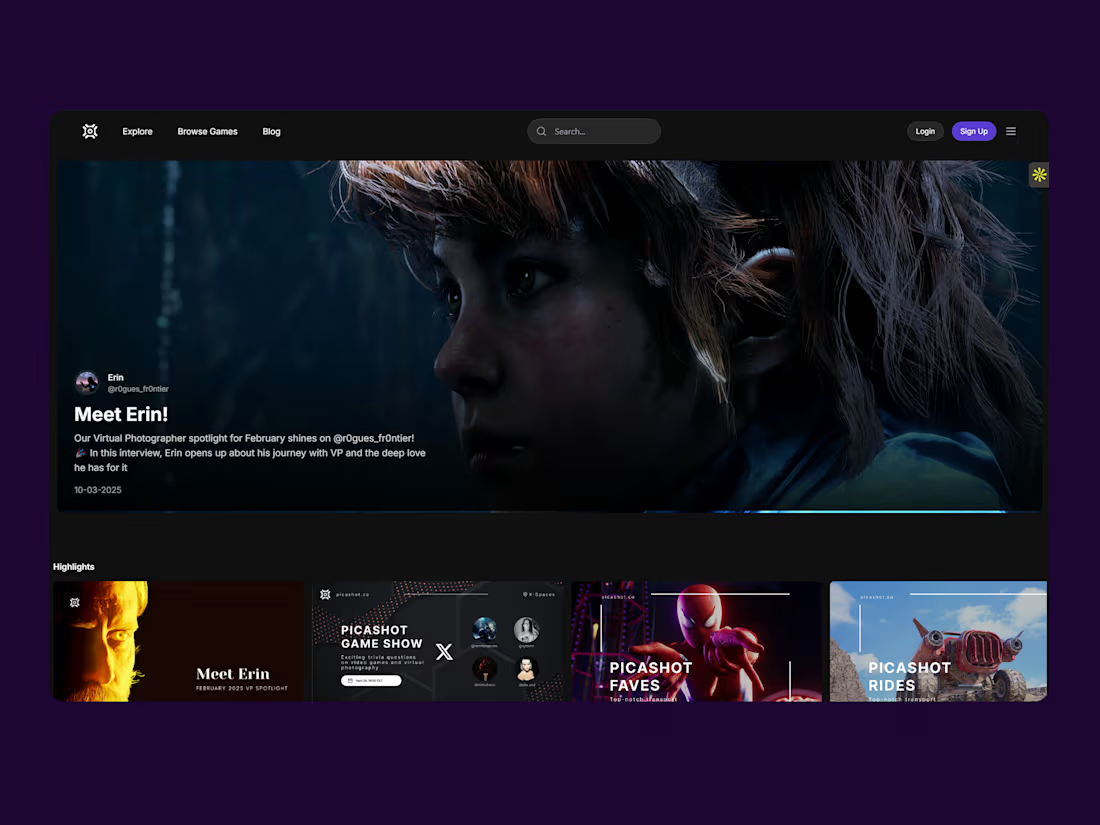
Picashot
3
9
Message
0
James Odukoya
COVID-19 Global Data Analysis
0
15
Message
0
Adepeju Oladapo
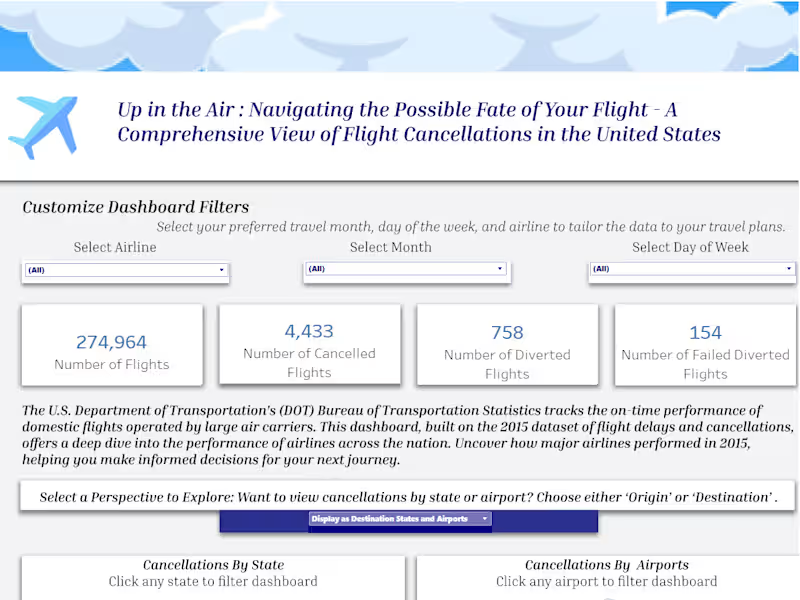
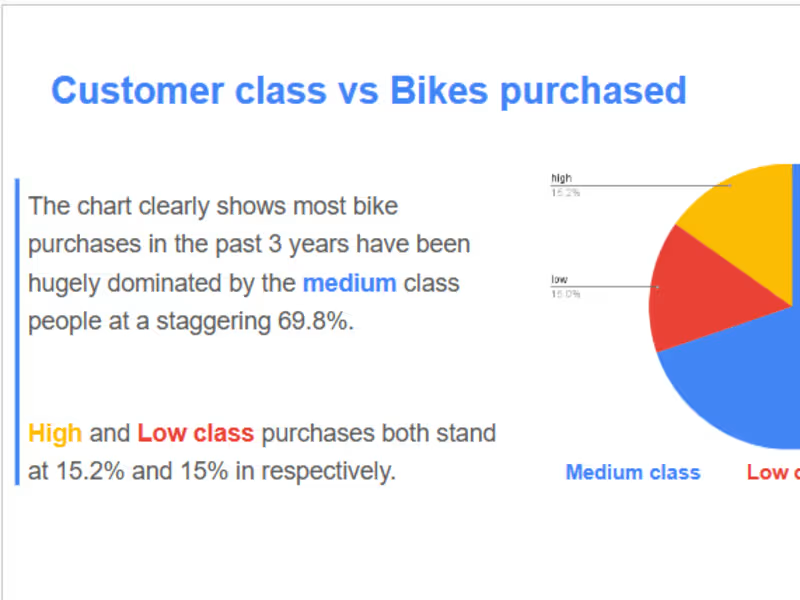
US Flight Analysis and Visualization with Tableau
0
85
Message
0
Abdulmumin Solihu
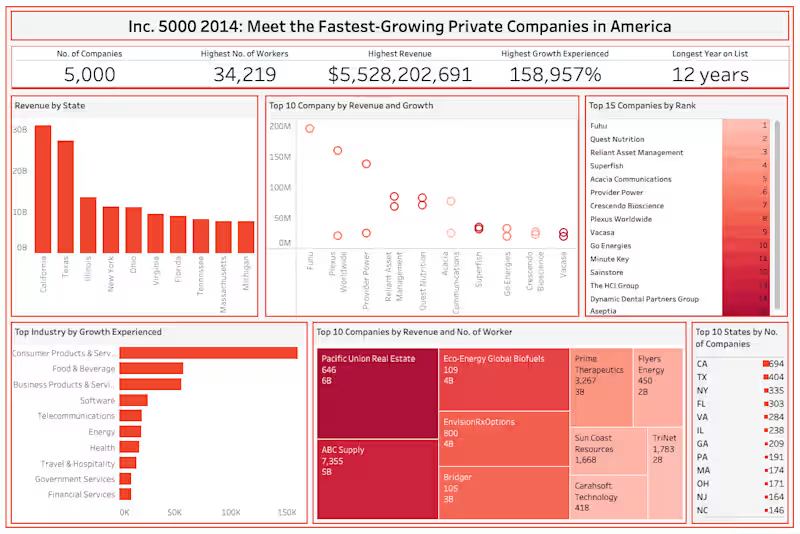
Analyzing the Growth and Revenue of Inc. 5000 2014 Companies
0
14
Message
0
Ikenna Charles Abara
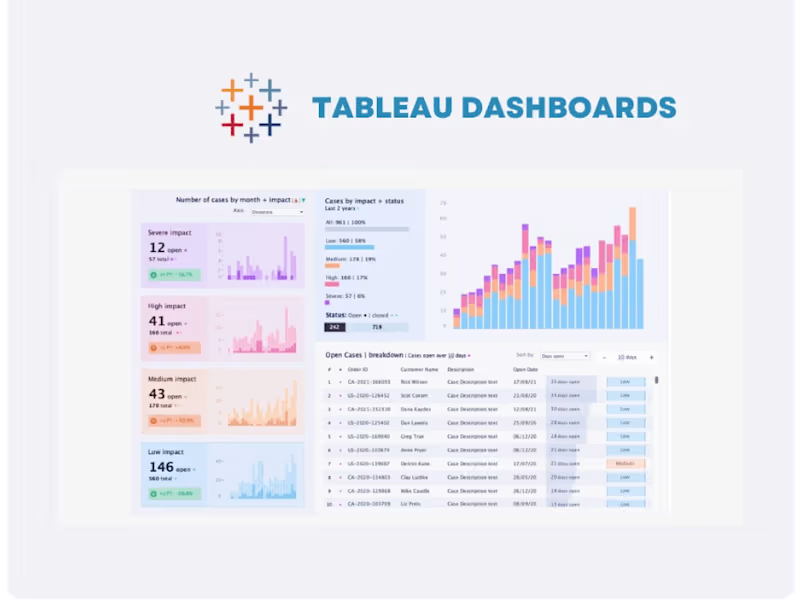
You will get a beautiful and interactive tableau dashboards
0
6
Message
0
Olamide Ogundiran
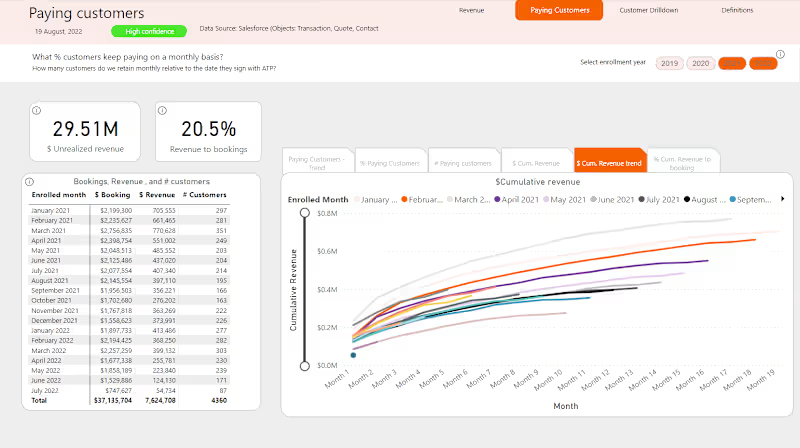
Acquisition Performance Dashboard
0
8
Message
0
Taofeek Salami
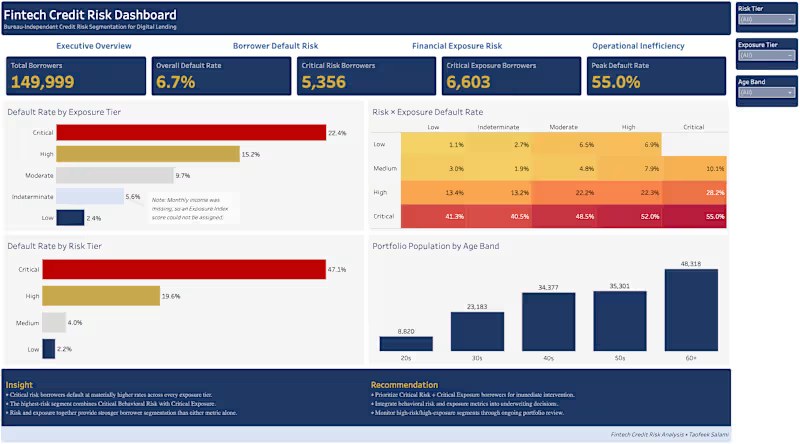
Bureau-Independent Credit Risk Segmentation
0
3
Message
0
Olorunfemi Obasa
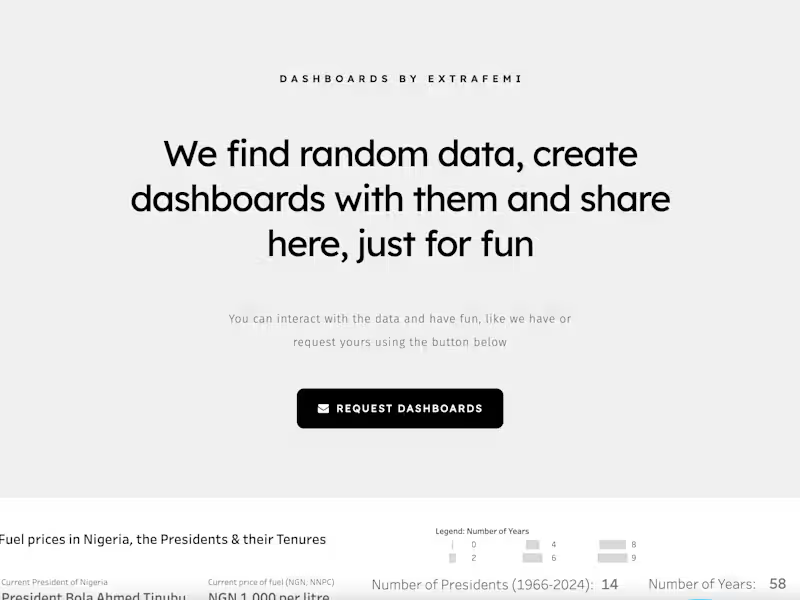
Carrd + Tableau data website design and integration
0
11
Message
1
Ifeoma (Eephomaa) Edu-Aniobi
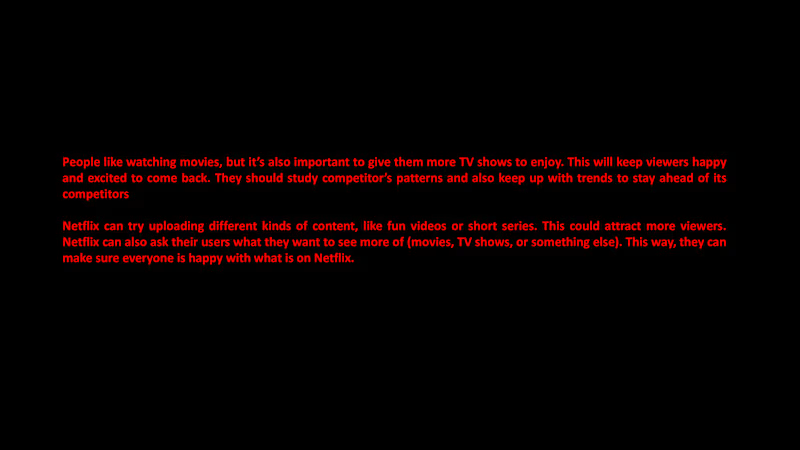
Netflix has a massive content library, but how well is it balanced? Are they meeting audience preferences? The client needed a clear, data-backed understanding of their content composition specifically, the ratio of movies to TV shows, genre distribution, regional availability, and content rating trends, to inform strategic decisions about future content acquisition and production. I conducted a comprehensive analysis of Netflix's content library using data sourced from Kaggle. My process and deliverables included: 1. Data Preparation (Excel): Cleaned and structured the raw dataset for analysis, ensuring data quality and consistency. 2. Data Querying (SQL): Wrote queries to extract key metrics—content count by type, genre distribution, rating categories, and country-wise availability. 3. Data Visualization (Tableau): Created interactive dashboards and visualizations to bring the data to life, including: i. Bar Charts: Showed the dominance of Drama, Documentaries, and Stand-up Comedy as top genres. ii. Map Visualization: Highlighted the USA (2,818 titles) and India (972 titles) as the countries with the most content. iii. Pie Chart: Visualized the 69.6% (movies) vs. 30.4% (TV shows) split. - Statistical Analysis (t-test): Performed a t-test confirming a statistically significant difference between movie and TV show uploads (t-value = 56.60, p-value = 0). - Trend Analysis: Identified the 2019 peak in content uploads and the subsequent decline in 2020–2021, correlating with the rise of competing platforms and the COVID-19 economic downturn. Strategic Recommendations: Provided actionable insights for Netflix: i. Increase TV show content to balance audience preferences. 2. Experiment with short-form content to attract broader audiences. 3. Conduct user surveys to align content strategy with viewer demand. 4. Study competitor patterns and emerging trends to stay ahead. A clear, data-driven analysis that provided Netflix with a comprehensive understanding of its content library and actionable recommendations to improve viewer engagement and retention.
1
119
Message
0
Victor Odutokun
Executive Report for Company Wide Performance
0
5
Message
0
Shedrack Eze
Empowering Business with Effective Insights
0
9
Message
0
Mercy Samson
Marketing & Sales consultation
0
4
Message
0
Adeyi Olamide
pro
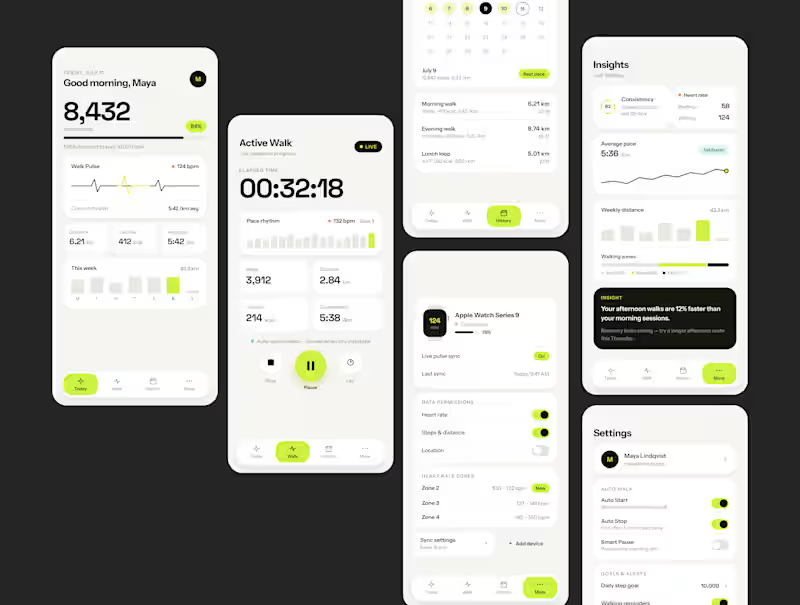
Stride Wellness App
0
4
Message
0
Abdulmumin Solihu
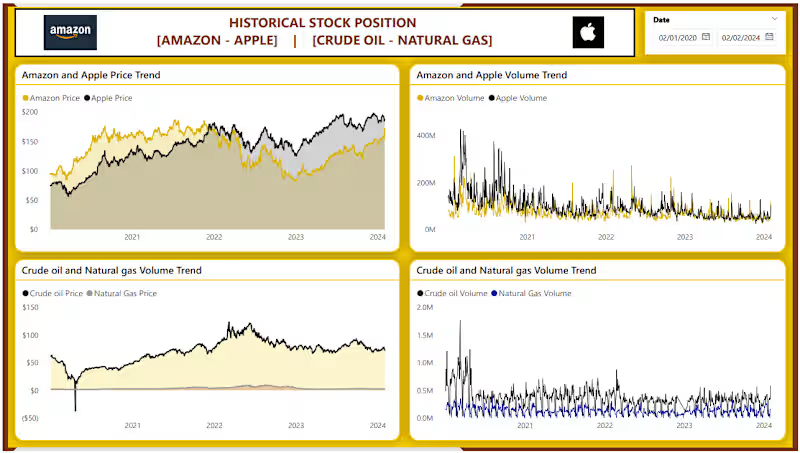
US Stock Markets: A Comparative Analysis of Major Stocks, Crypto
0
8
Message
0
Shedrack Eze
KPMG AU Data Analytics Job Simulation
0
22
Explore projects