
Dieudonné NAHIMANA
Data Analyst
Ready for work
Dieudonné is ready for their next project!
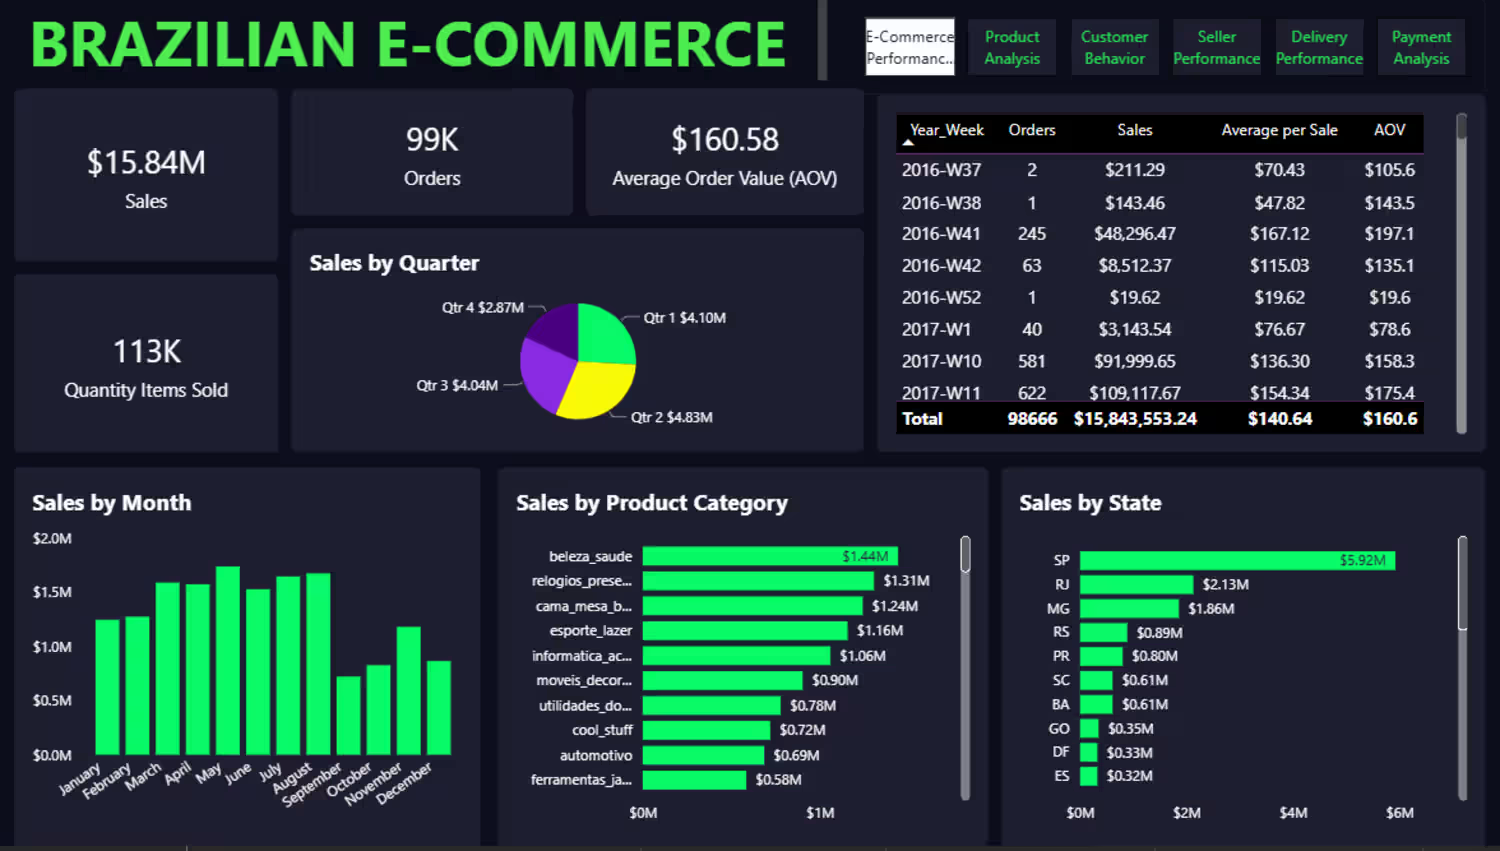
Olist is a Brazilian tech & e-commerce company founded in 2015 in Curitiba, Paraná. The dataset collected from Kaggle is full of missing values and mismatched data, a lot of typos. I tried to build a report based on the collected data. I cleaned up much of the data, corrected typos of a millions rows. When I started building the report i did not notice any issue until I want to build some KPIs, then I went back where I pulled the data and found a lot of comments stating how many things miss. Then I said to my self, what if the data were like that, what would it mean for a business.
1
13
Between 2016 and 2021, the business generated a total revenue of $55.3 million. The company experienced three consecutive years of strong growth, reaching its highest performance in 2019, before suffering a significant decline in 2020 due to the global COVID-19 pandemic. The downturn continued into 2021, resulting in a substantial reduction in both revenue and sales volume across all product categories.
Among all product categories, Computers was the most profitable, generating $4.06 million in profit and accounting for the largest share of total profits, followed by Home Appliances.
From a geographical perspective, the United States was the most profitable market, followed by Canada. Together, these two countries consistently generated more than $2 million in annual profit, with 2019 being the strongest year, producing more than $7 million in combined profit.
1
9
Happy new year everybody, just drop a new project, check on my github page: https://github.com/Nahi-Donne/Maven-Fuzzy-Factory
1
1
38
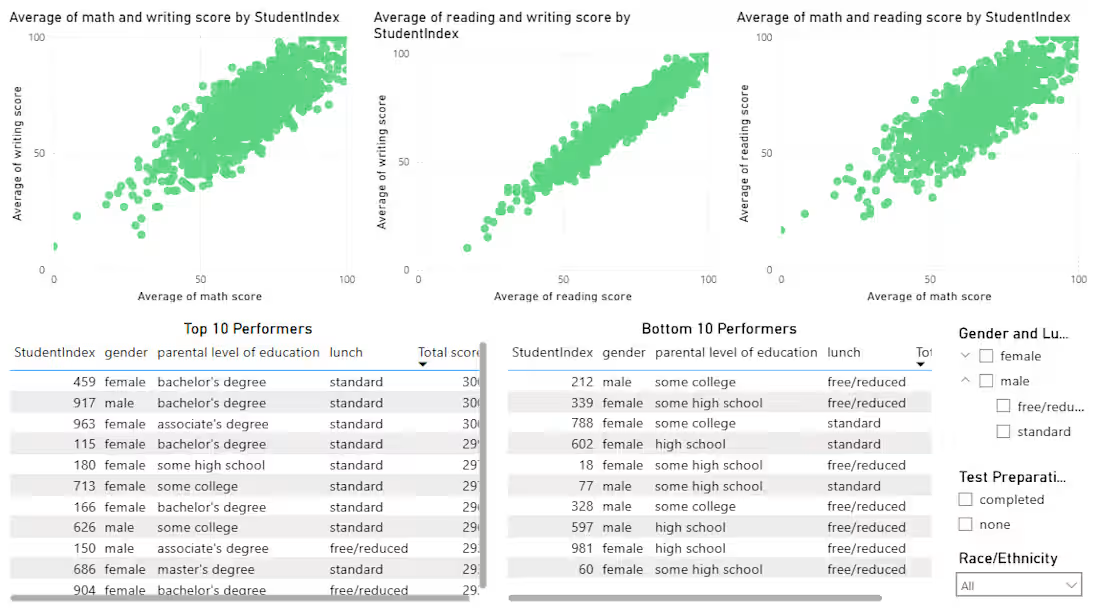
Student Performance: A case study where I analyzed how student scored based on different factor such as lunch, parental school backgroup, test preparation, race.
0
50