
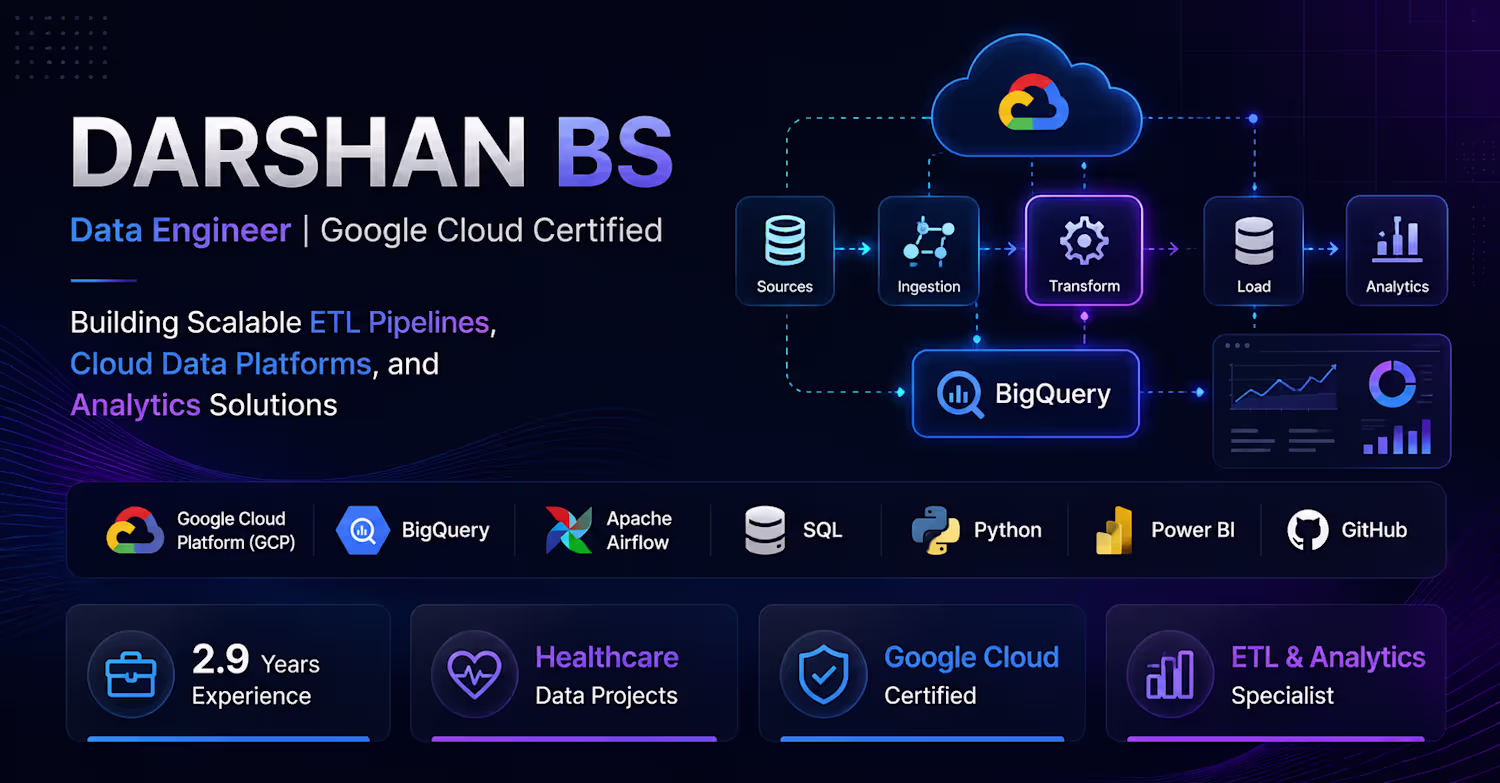
Darshan Bs
Turning raw numbers into reports that actually get read.
New to Contra
Darshan is building their profile!
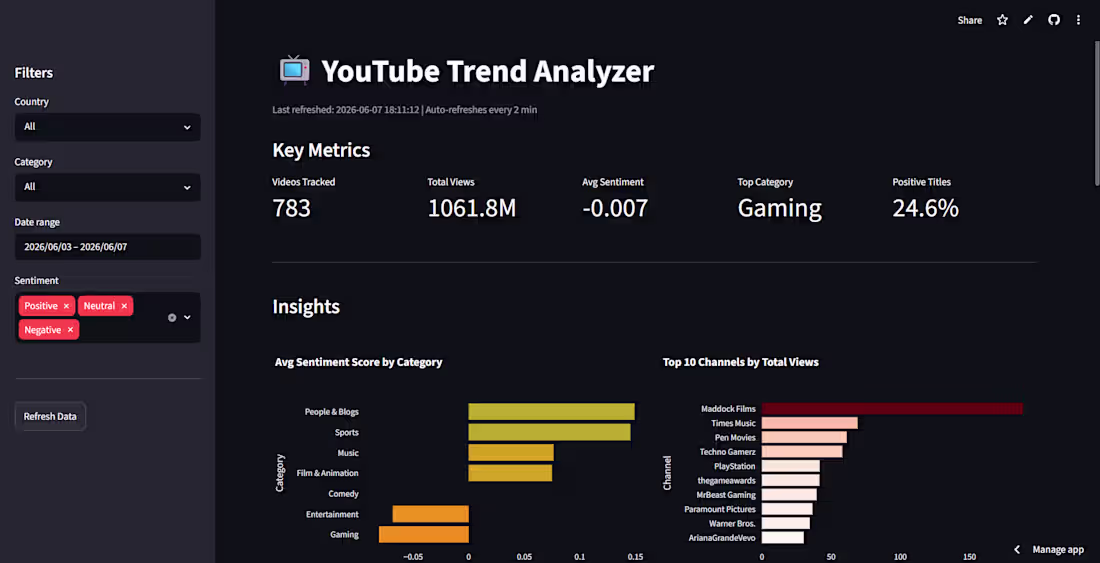
I just built a real-time data dashboard to track what is
trending on YouTube! 📊
This tool helps creators and brands see which videos get the
most views and how viewers feel about them.
✨ Key Features
Live tracking: Updates automatically every two minutes.
Sentiment analysis: Scores viewer feelings across different video categories.
Smart filtering: Sorts data by country, category, and custom date ranges.
Top channel stats: Visualizes the biggest players by total view counts.
🛠️ Tech Stack
Python, Streamlit, YouTube Data API, Data Visualization (Pandas & Plotly)
0
0
A few months ago, I was manually comparing source and target tables to find data issues.
Today, I built a Data Quality Monitoring Dashboard that automatically detects anomalies, tracks validation metrics, and provides real-time visibility into data health.
Here's what the project looked like 👇
─────────────────────
🔷 The Problem
─────────────────────
Modern data pipelines process thousands of records every day.
But one missing value, duplicate record, or failed transformation can impact reports, dashboards, and business decisions.
Teams often discover these issues too late.
My goal was simple:
Build a centralized dashboard that continuously monitors data quality and highlights issues before they become business problems.
─────────────────────
⚙️ Step 1 — Data Validation Framework
─────────────────────
Created automated validation checks across multiple datasets.
The framework monitors:
→ Record count mismatches
→ Null value violations
→ Duplicate records
→ Data completeness
→ Business rule validation
→ Source-to-target reconciliation
Instead of manually checking tables, every validation runs automatically.
─────────────────────
📊 Step 2 — Monitoring Dashboard
─────────────────────
Built an interactive dashboard to visualize data quality metrics.
Key sections included:
🟢 Data Quality Score
📈 Trend Analysis
⚠️ Failed Validation Checks
🔍 Table-Level Health Monitoring
📋 Data Reconciliation Status
The dashboard enables teams to quickly identify issues and take corrective action.
─────────────────────
💡 Key Outcomes
─────────────────────
✅ Reduced manual validation effort
⚡ Faster identification of data issues
📉 Improved reporting accuracy
🔍 Increased visibility into pipeline health
🚀 Enhanced trust in business-critical data
─────────────────────
Tech Stack:
• SQL
• BigQuery
• ETL Pipelines
• Data Validation
• Data Quality Monitoring
• Data Warehousing
Data quality isn't just about fixing errors.
It's about building confidence in every business decision powered by data.
#DataEngineering #DataQuality #BigQuery #SQL #ETL #DataWarehouse #Analytics #Dashboard #PortfolioProject #DataGovernance
0
15
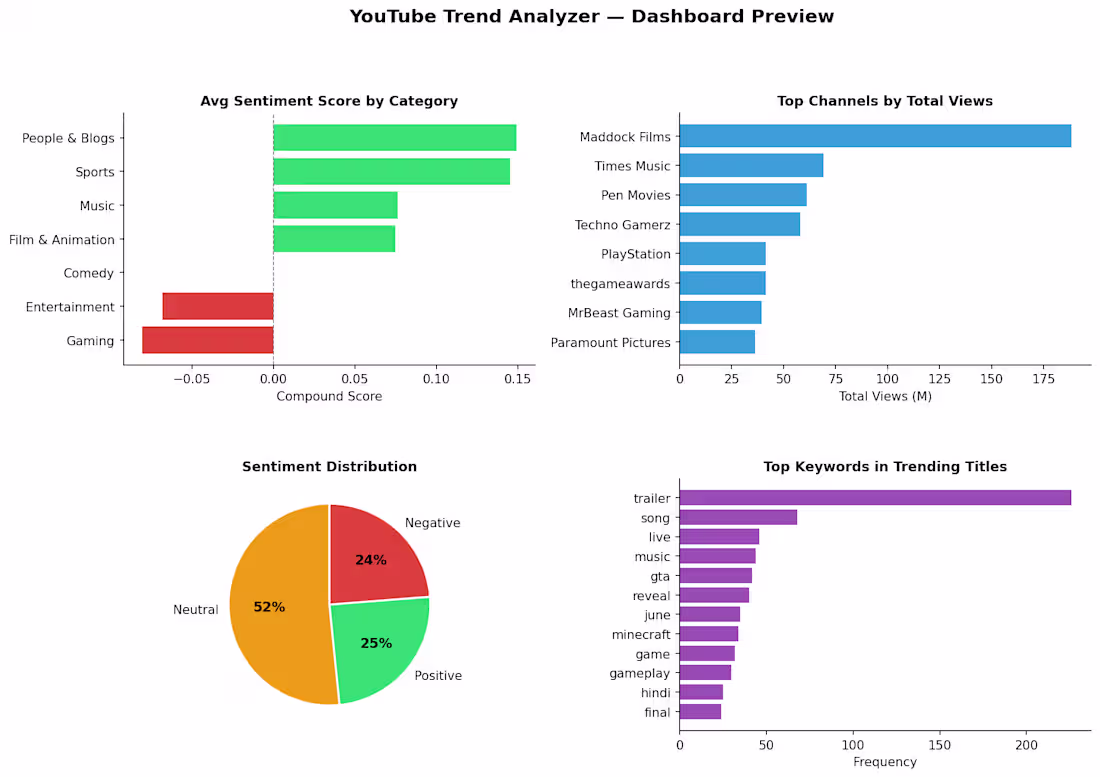
YouTube Trend Analyzer – End-to-End Data Analytics Project
Built an end-to-end analytics solution to analyze YouTube trending videos using Python, SQL, and data visualization techniques. Extracted, transformed, and analyzed trending data to identify content patterns, engagement metrics, and category performance. Created interactive dashboards and generated actionable insights from large datasets.
0
34