The network for creativity
Join 1.25M professional creatives like you
Connect with clients, get discovered, and run your business 100% commission-free
Creatives on Contra have earned over $150M and we are just getting started
Back to feedPost

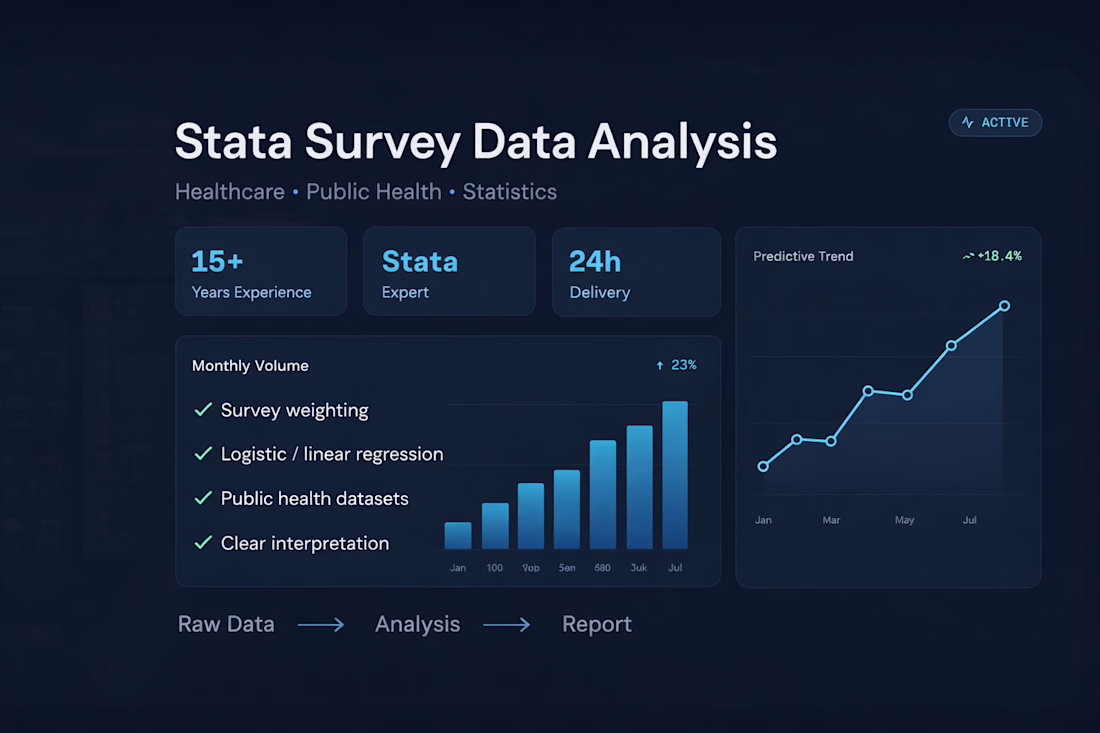
Analyzed survey and healthcare datasets using Stata. Performed weighting, regression analysis, statistical modelling and clear interpretation of results to support research, policy and business decisions.


The network for creativity
Join 1.25M professional creatives like you
Connect with clients, get discovered, and run your business 100% commission-free
Creatives on Contra have earned over $150M and we are just getting started




Related posts

This is such a great example of turning complex data into a visual experience. 🎾🔥
Love how the court becomes part of the analytics instead of just sitting in the background. Really impressive work!

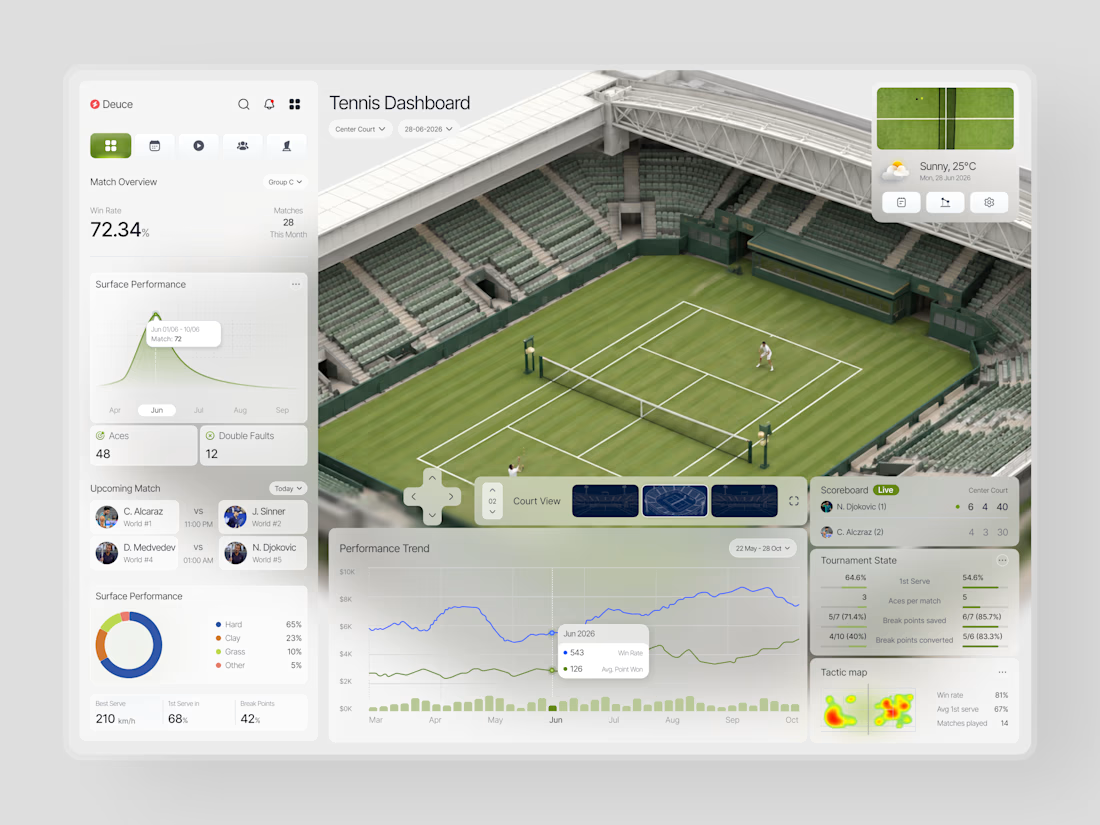
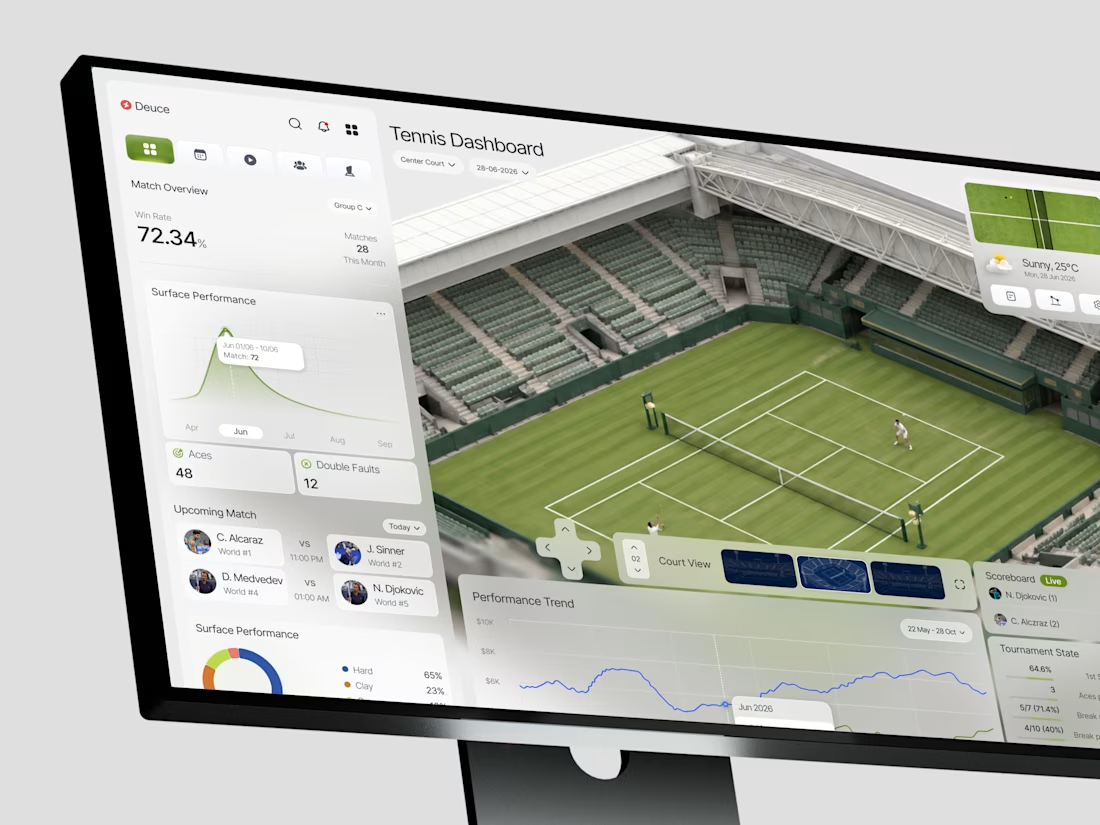
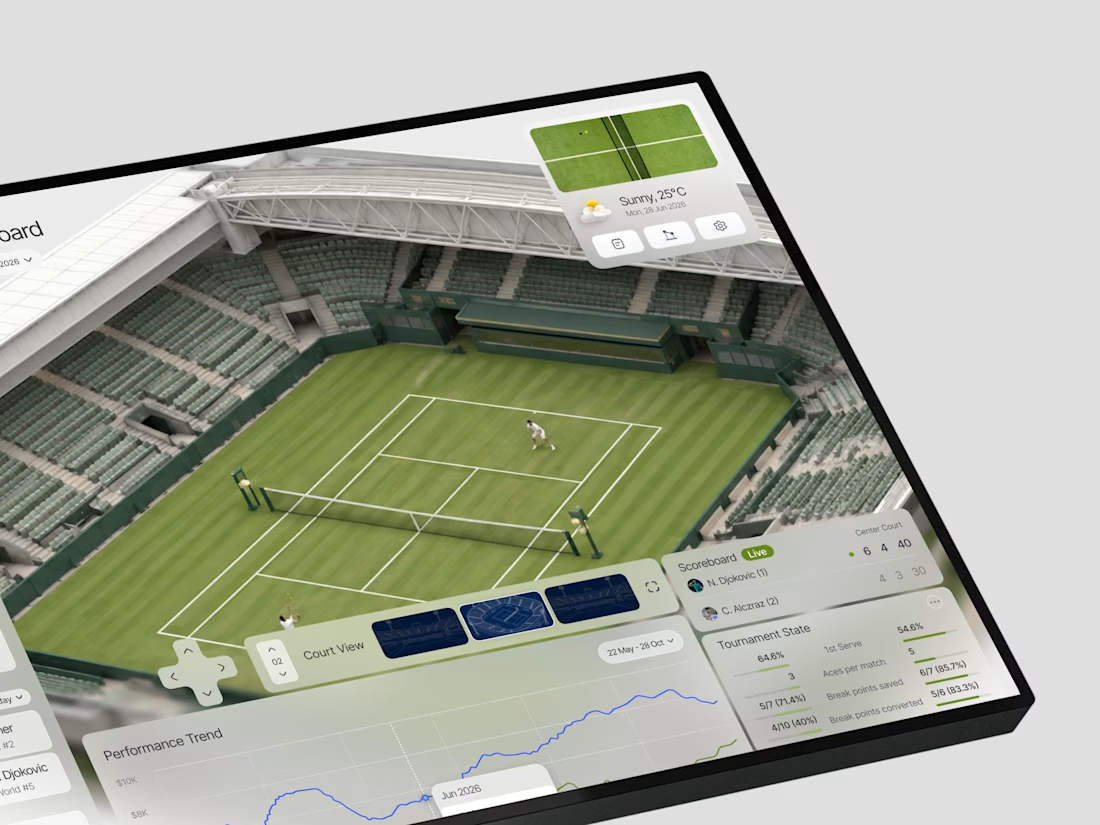
When does a sports dashboard need the court to be more than a background?
In this case, we were designing Deuce a tennis analytics platform that needed to make complex match data feel immediate and spatial, not just numerical.
The brief was clear: analysts and coaches don't just...

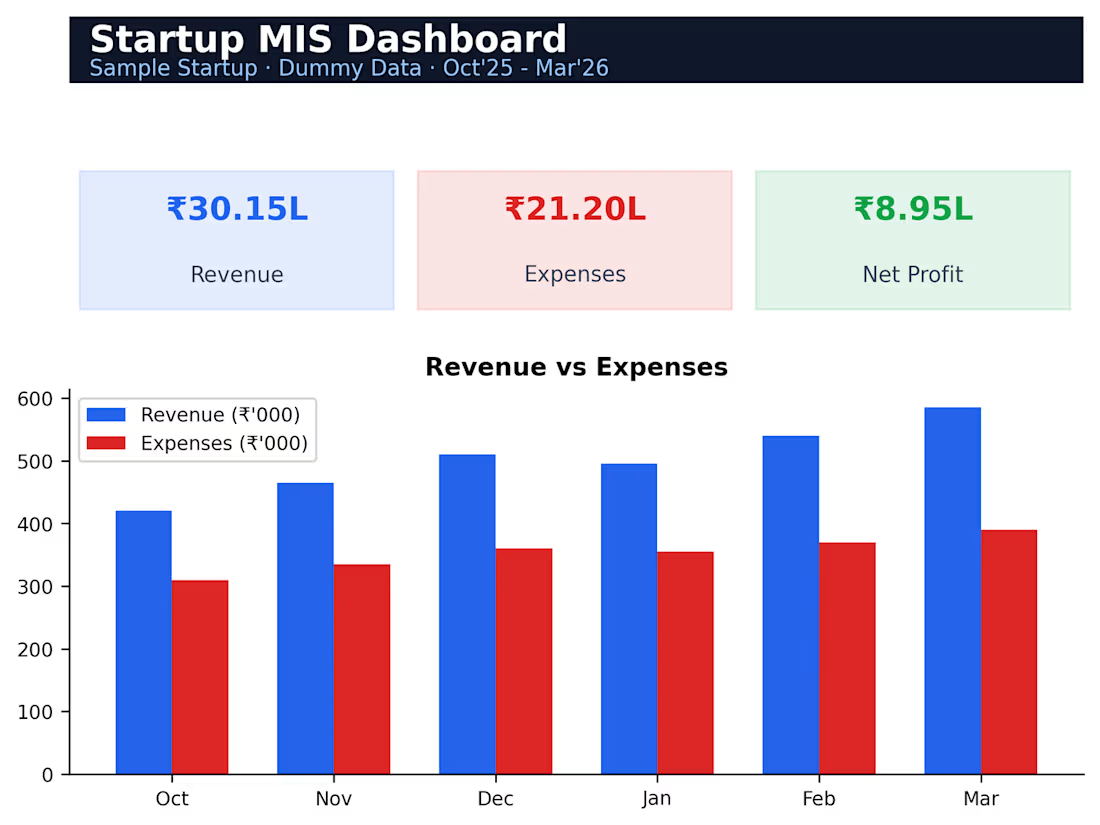
A 6-month MIS dashboard tracking revenue, expenses, net profit and margin trends with an auto-updating bar chart, giving founders a one-page view of business health.