The network for creativity
Join 1.25M professional creatives like you
Connect with clients, get discovered, and run your business 100% commission-free
Creatives on Contra have earned over $150M and we are just getting started
Back to feedPost

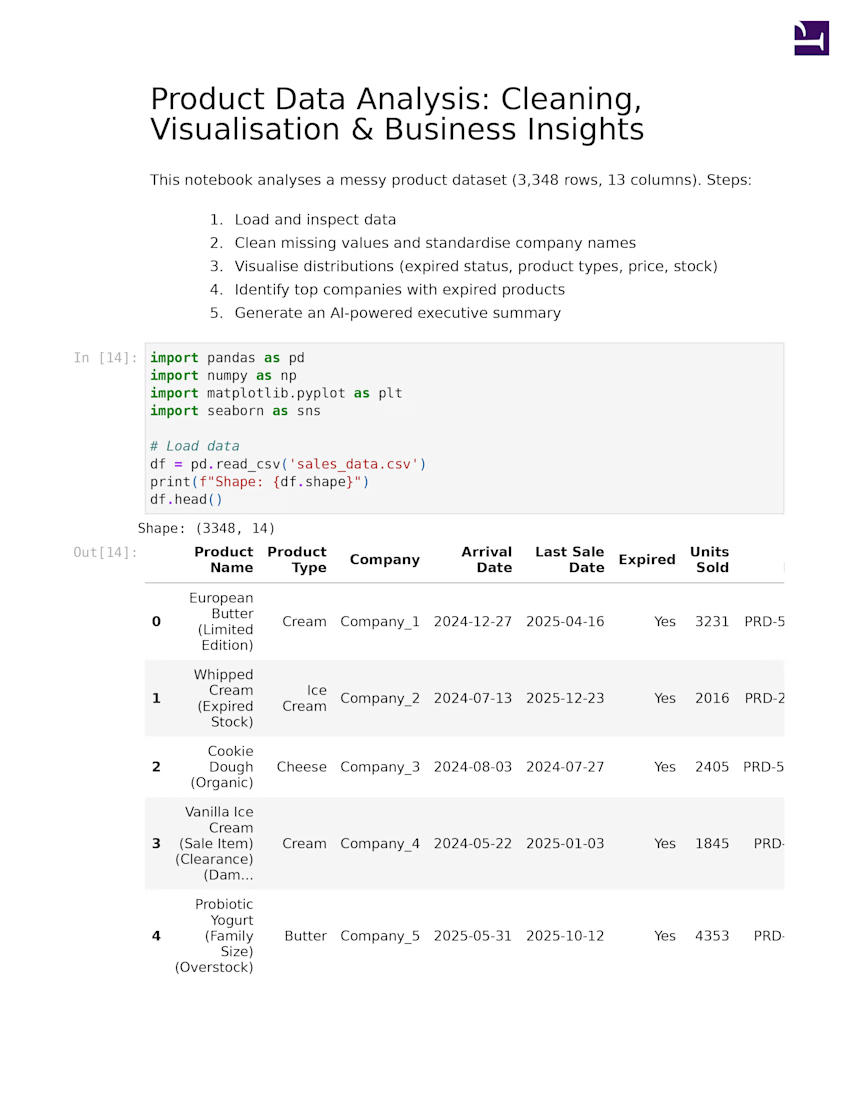
[AI-Powered Product Data Analysis using Python & Groq]
Analyzed a messy product dataset with 3,348 rows
and 13 columns using Python, pandas, matplotlib,
seaborn, and Groq AI.
Key Findings:
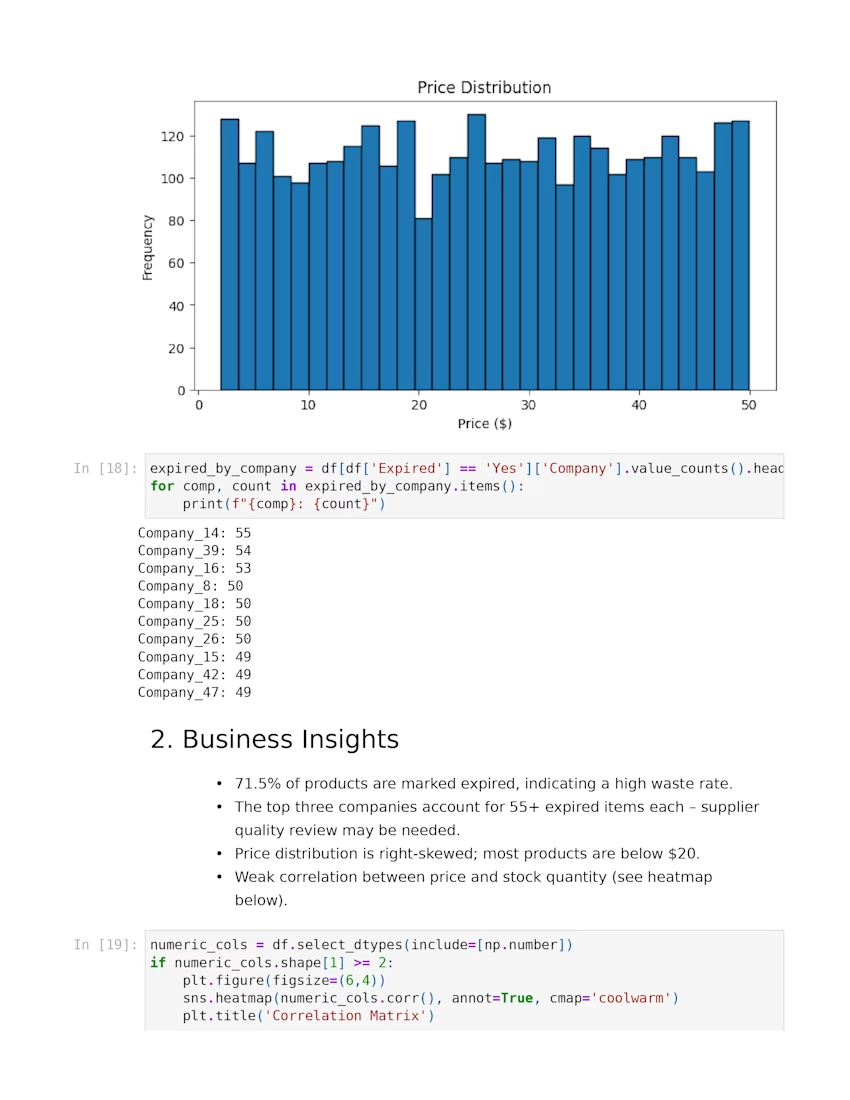
→ 71.5% of products marked expired
→ Top companies identified with highest expired stock
→ Price distribution analyzed across all products
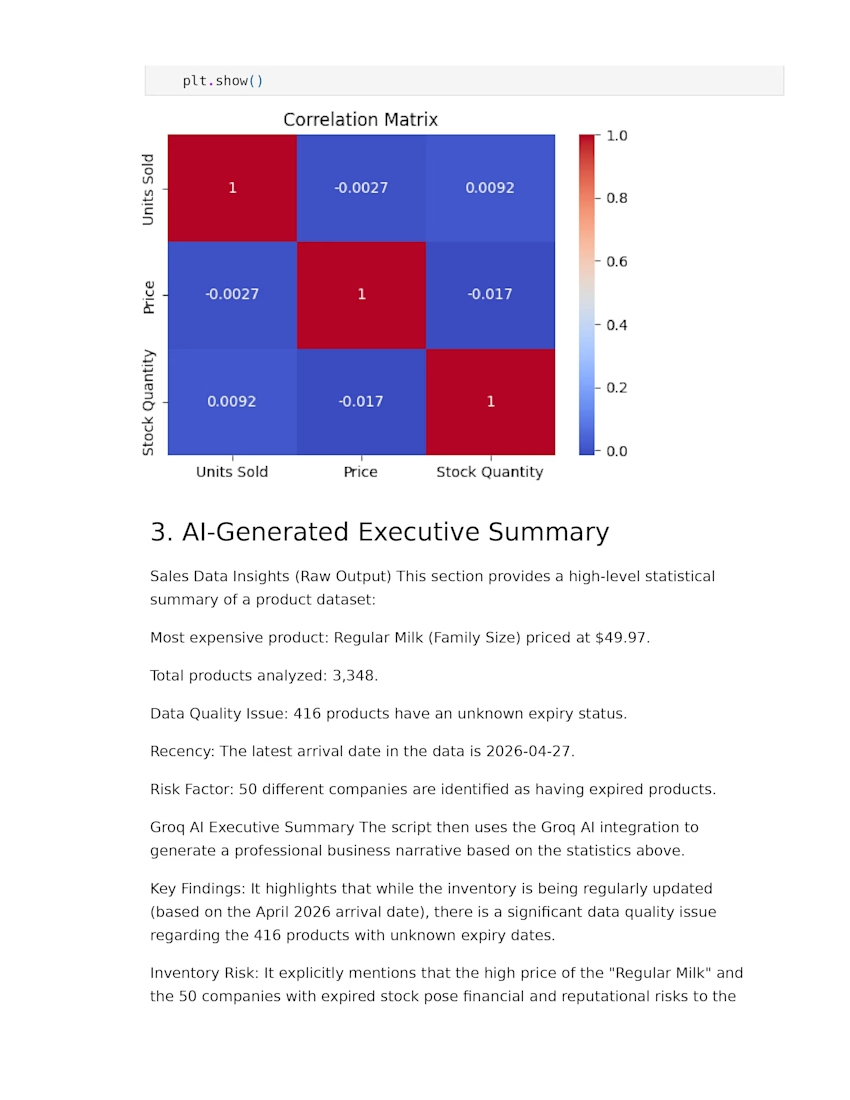
→ AI generated executive business summary
Tools used: Python, pandas, numpy, matplotlib,
seaborn, Groq API, LLaMA model


The network for creativity
Join 1.25M professional creatives like you
Connect with clients, get discovered, and run your business 100% commission-free
Creatives on Contra have earned over $150M and we are just getting started











Related posts

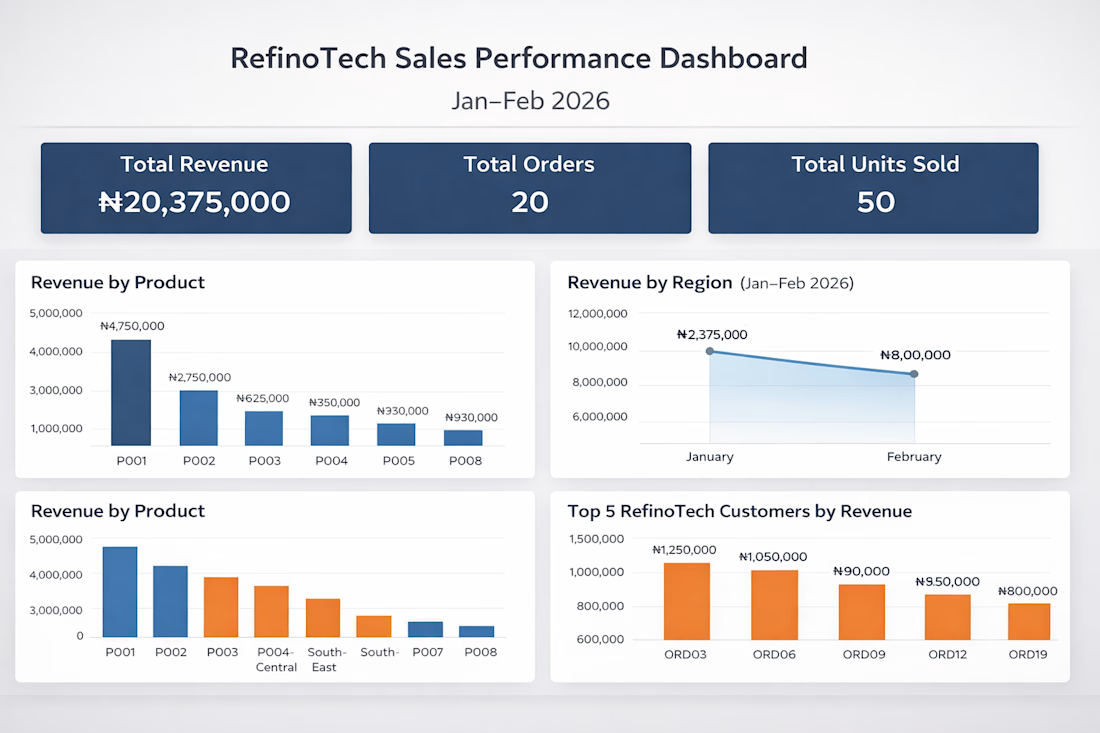
How I Built an End-to-End Sales Analytics Dashboard in Excel for an E-commerce Company
I recently completed an end-to-end sales analytics project using Microsoft Excel, transforming raw e-commerce sales data into an interactive dashboard that provides meaningful business insights.
In this project, I explored the data, performed analysis, identified key sales trends, and built an interactive dashboard to help businesses make data-driven decisions.
I documented the entire process, including the approach, tools, analysis, and dashboard development.
Read the full project walkthrough on Medium: https://medium.com/@Refino/how-i-built-an-end-to-end-sales-analytics-dashboard-in-excel-for-an-e-commerce-company-e8692d81f354



Excellent work! Turning raw data into actionable business insights is a valuable skill.

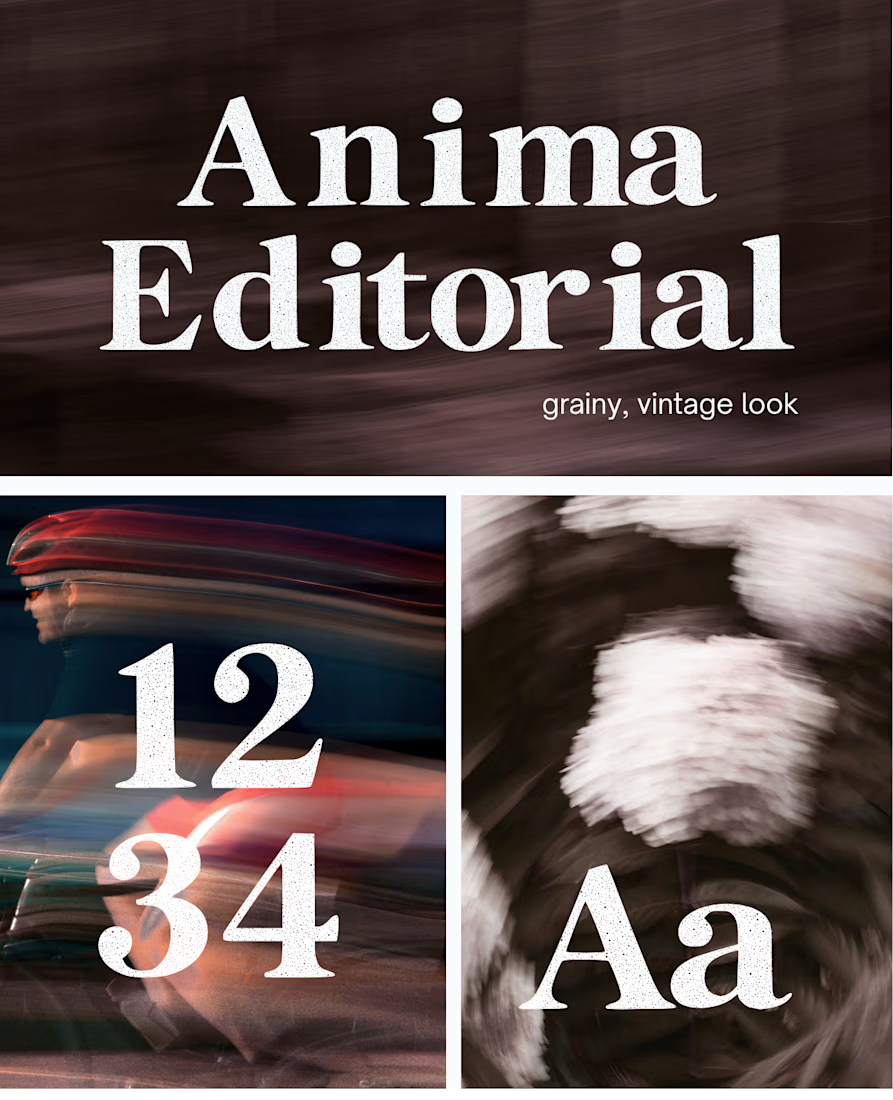
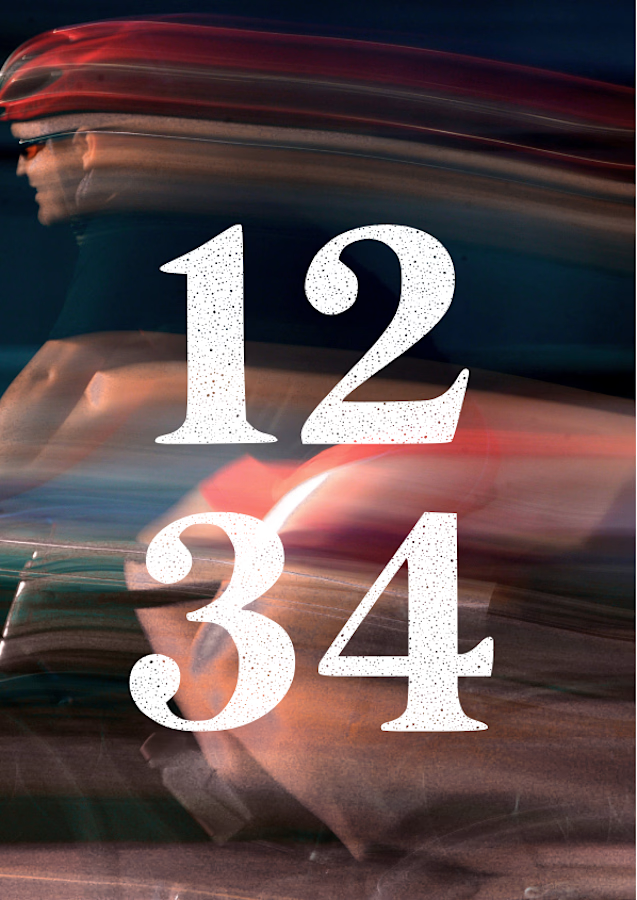
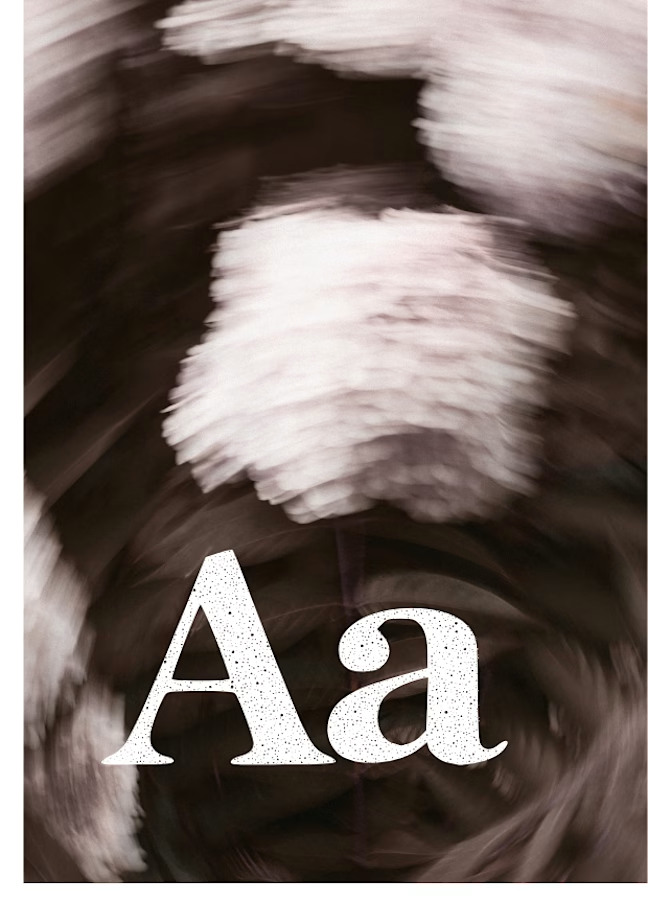
I created this font & it is free to download and use in your free or paid projects. Enjoy 🚀 find it at https://twaperdigital.com/anima-editorial


I like this font
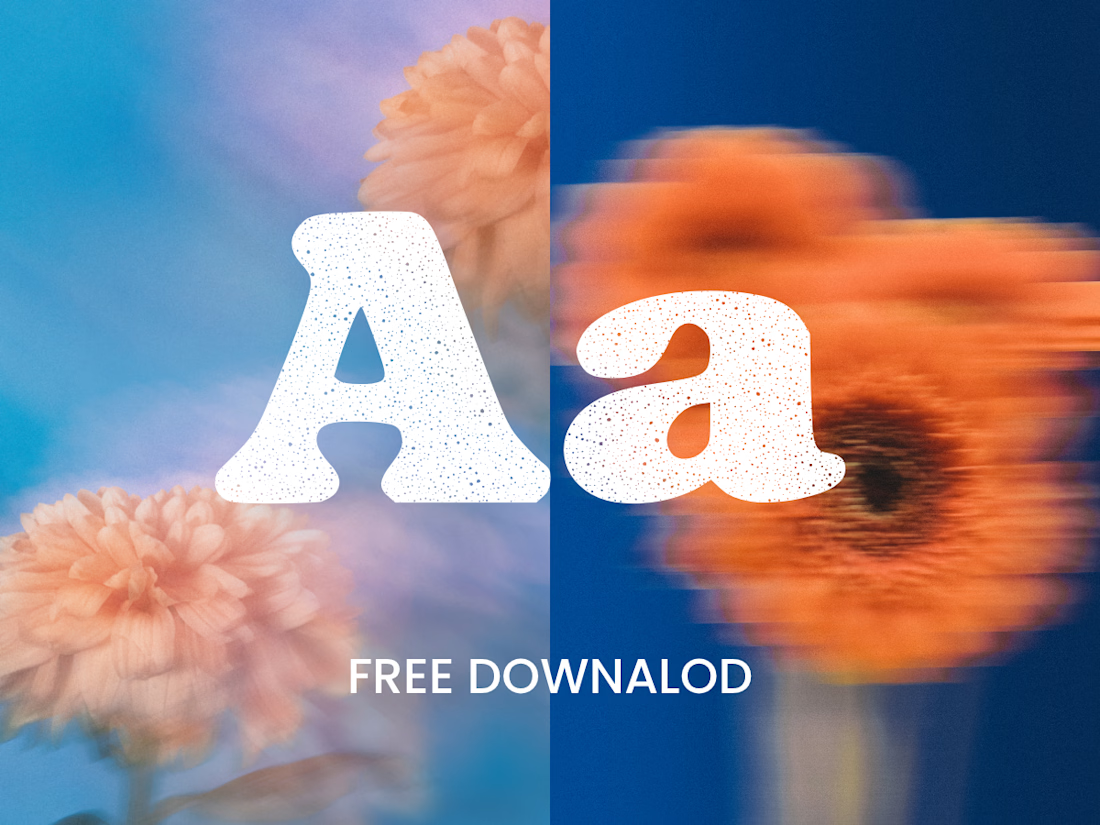
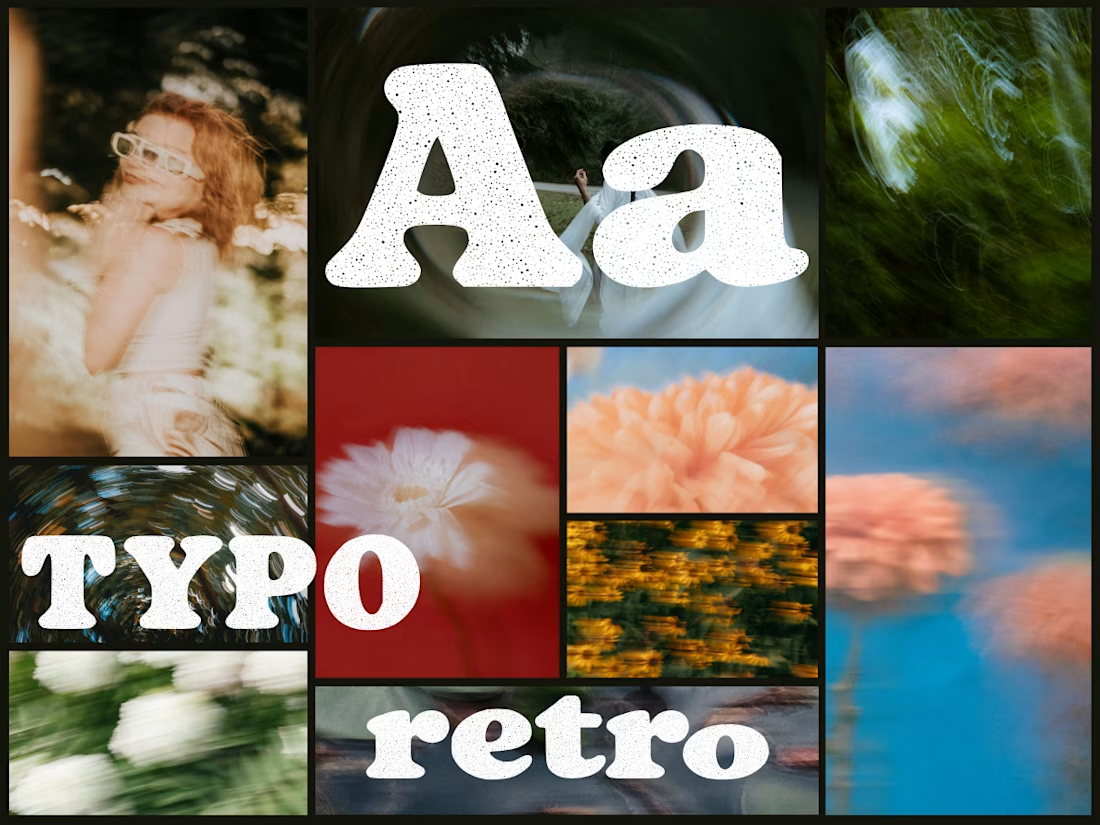
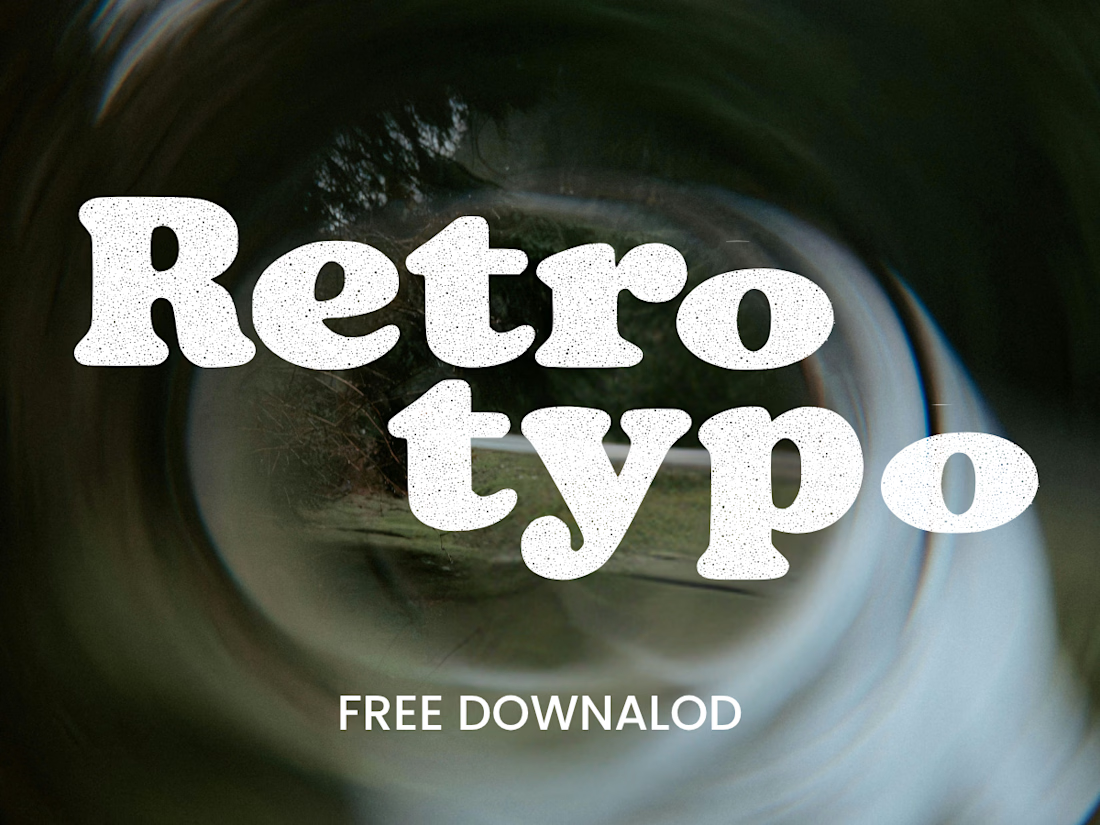
Anima is a self-initiated type design project inspired by vintage print, worn ink and analog photography.
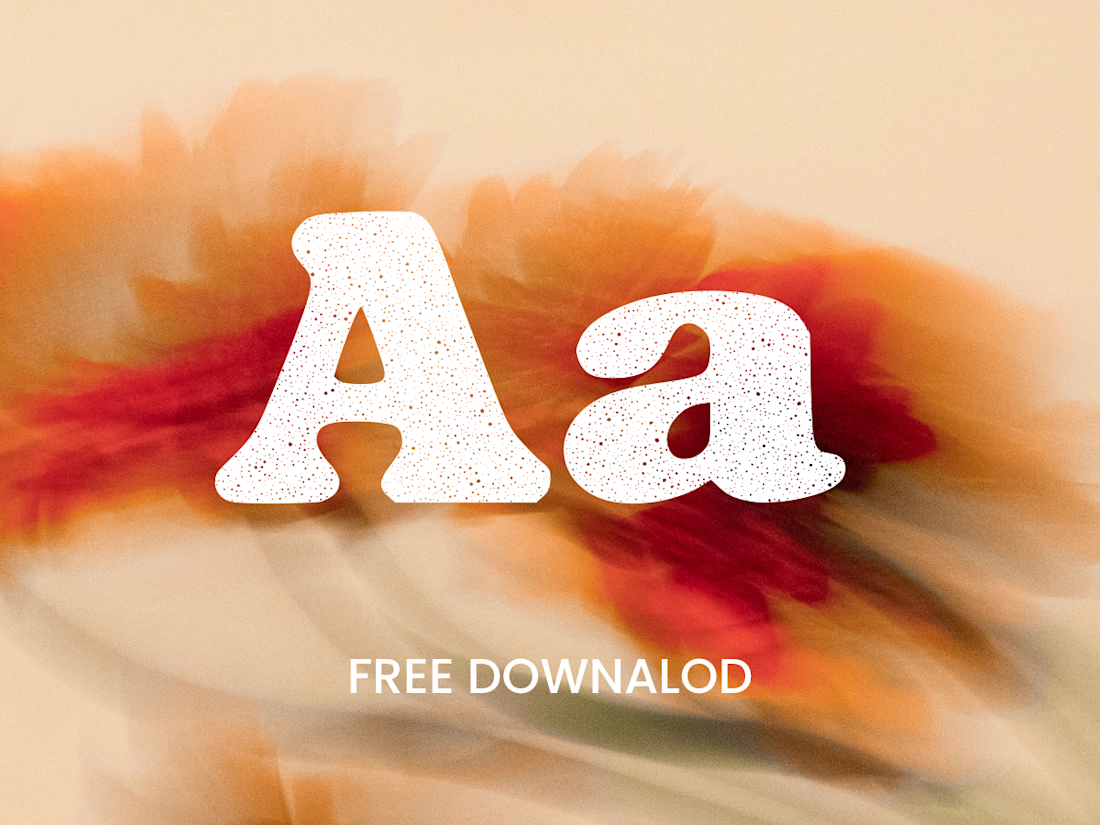
The collection includes two experimental serif typefaces: Anima Editorial, with elegant proportions and contrasting strokes, and Anima Retro, with softer, bolder shapes. Both feature grain built into the letterforms.
I developed the creative direction, custom fonts and promotional artwork, combining AI-assisted exploration with font development. The campaign pairs textured typography with motion-blurred photography to capture a warm, nostalgic mood. FREE DOWNLOAD AT https://twaperdigital.com/anima-retro


Great job Denisa the font style background and it's effects are great 🎉🎉🎉🎉
keep going Denisa🔥🔥🔥🔥