The network for creativity
Join 1.25M professional creatives like you
Connect with clients, get discovered, and run your business 100% commission-free
Creatives on Contra have earned over $150M and we are just getting started
Back to feedPost


The network for creativity
Join 1.25M professional creatives like you
Connect with clients, get discovered, and run your business 100% commission-free
Creatives on Contra have earned over $150M and we are just getting started
Related posts

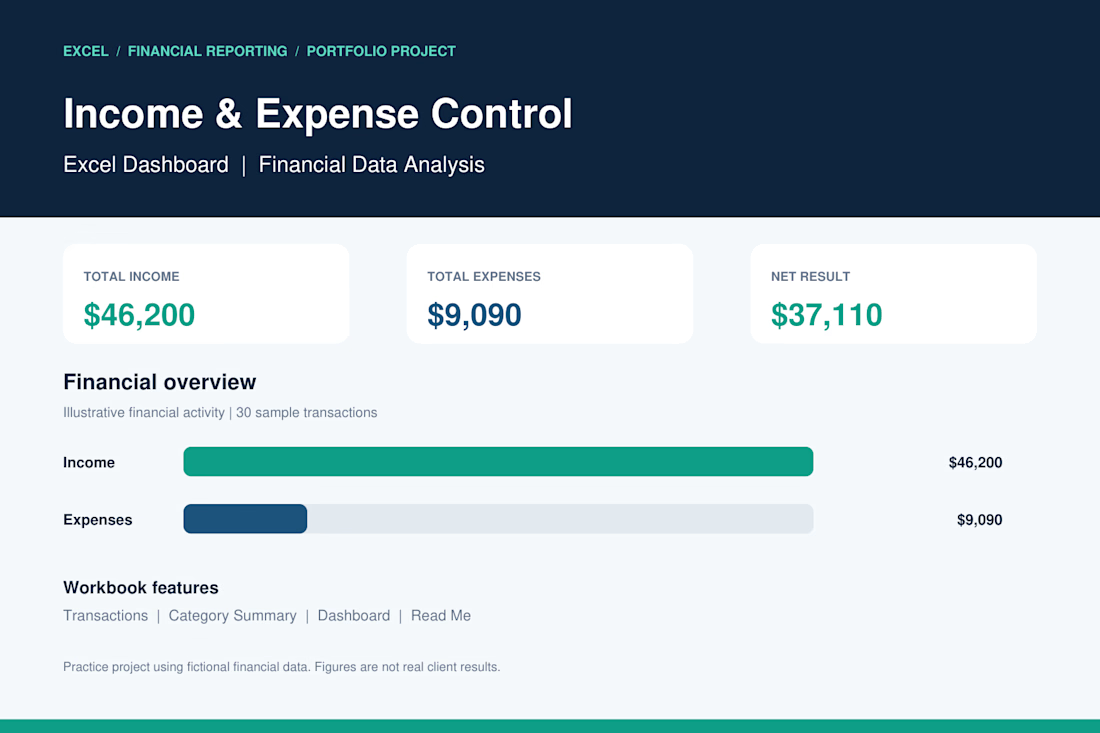
Income & Expense Control | Excel Dashboard
I developed a professional Excel dashboard as a portfolio practice project to demonstrate my skills in financial data management, income and expense tracking, and business reporting.
Project Features:
Automated income and expense calculations.
Financial dashboard with key performance indicators (KPIs).
Transaction tracking and organization.
Expense analysis by category.
Financial charts and visual reporting.
Net income calculation.
Project Results (Sample Data):
Total Income: $46,200
Total Expenses: $9,090
Net Result: $37,110
Tools: Microsoft Excel
Skills: Data Analysis, Accounting, Financial Reporting, Data Entry.
This project demonstrates my ability to organize financial records, analyze business performance, and create clear financial reports using Microsoft Excel.
Note: This is a portfolio demonstration using fictional financial data.

Great work 👏🏻

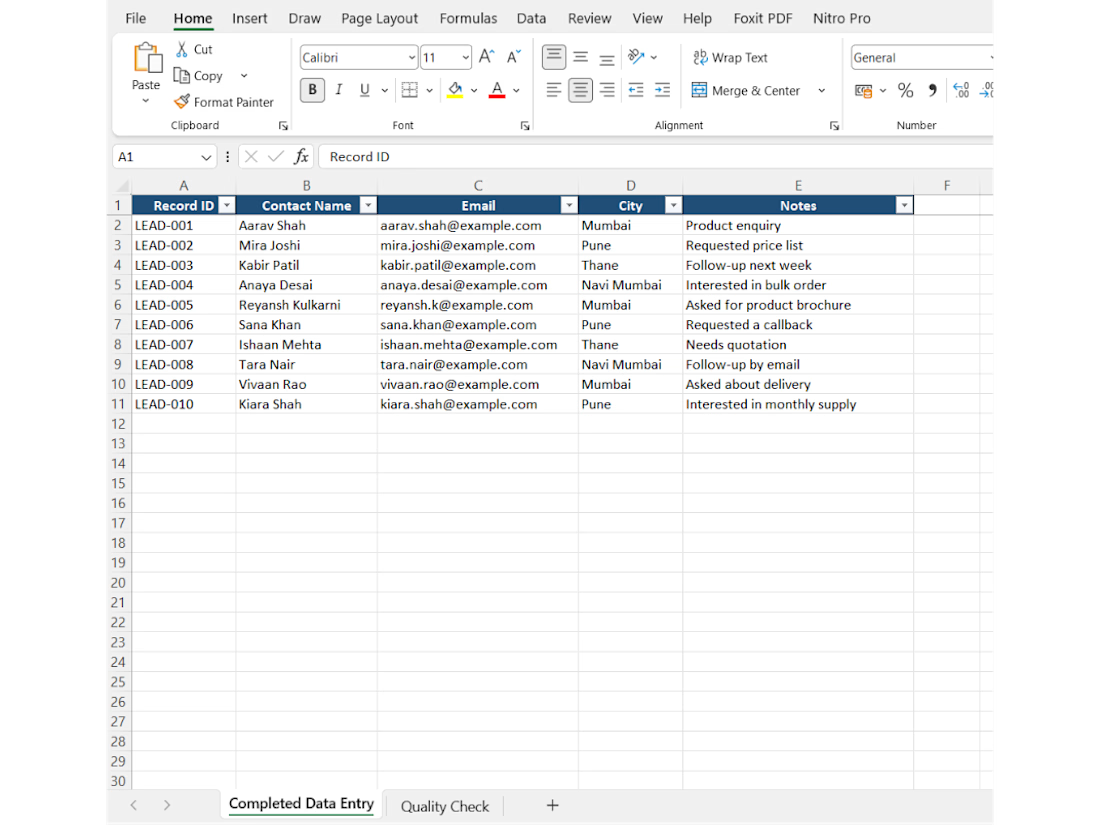
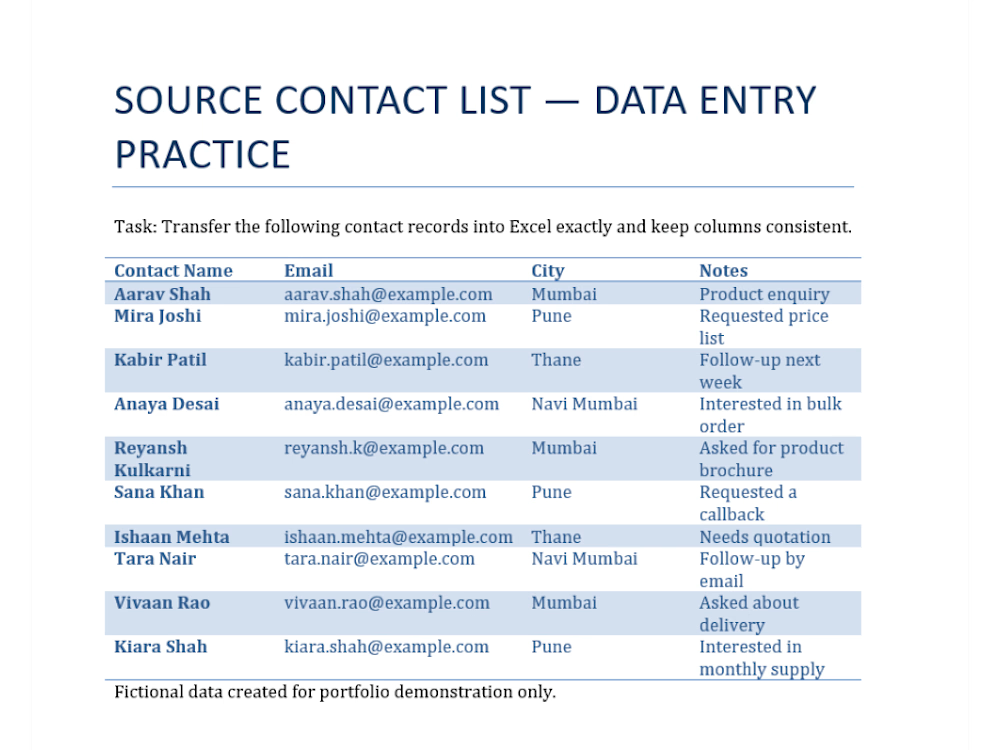

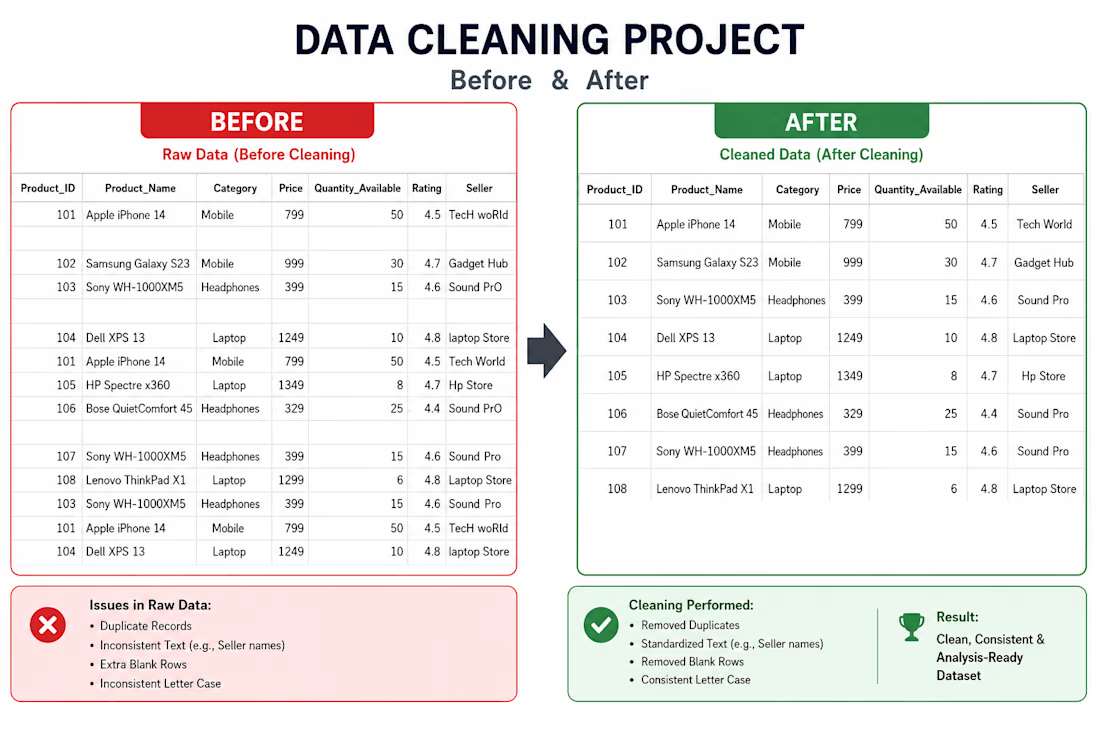
Data Cleaning & Formatting | Excel & Google Sheets
Raw data is often inconsistent, duplicated, or difficult to analyze. Proper data cleaning helps make it more accurate, organized, and ready for analysis.
What I focus on:
-Removing duplicate records
-Handling missing and inconsistent values
-Standardizing data formats
-Organizing datasets for easier analysis
My goal is to transform messy data into clean, structured, and analysis-ready datasets.
if you need support with data cleaning and formatting, feel free to connect with me.
#DataCleaning#MicrosoftExcel#GoogleSheets#DataAnalytics