The network for creativity
Join 1.25M professional creatives like you
Connect with clients, get discovered, and run your business 100% commission-free
Creatives on Contra have earned over $150M and we are just getting started
Back to feedPost


The network for creativity
Join 1.25M professional creatives like you
Connect with clients, get discovered, and run your business 100% commission-free
Creatives on Contra have earned over $150M and we are just getting started



Related posts

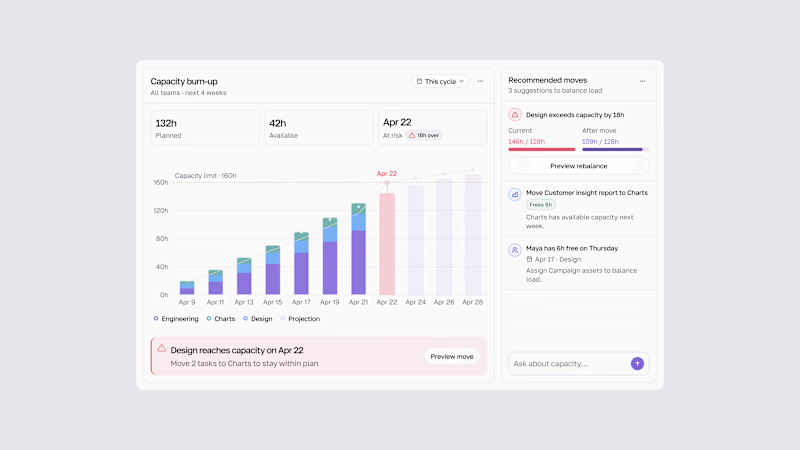
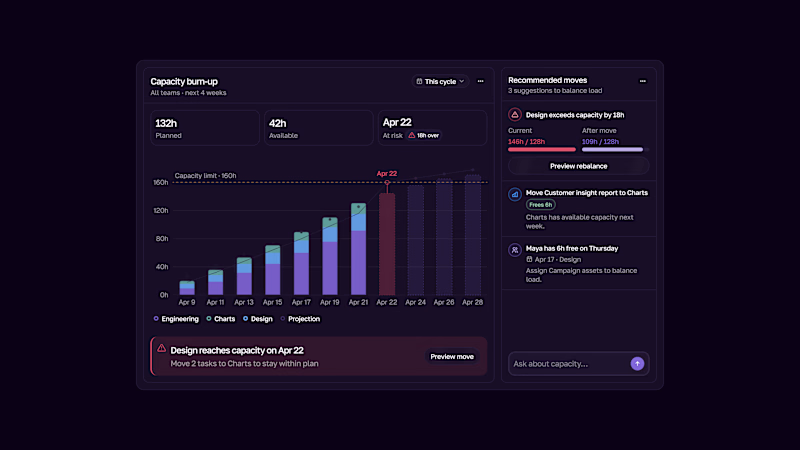
Capacity burn-up UI.
Track team workload, spot capacity risks early, and rebalance work before teams get overloaded.
Light & Dark modes.

2 voted
33%
4 voted
67%
6 votes
Closed

This is the kind of dashboard that actually gets used — the burn-up chart makes overload visible at a glance instead of hiding it in a table somewhere. I like that the point is spotting the risk early, not just reporting it after the fact. Both modes read well, though the dark one makes the chart pop a bit more for me.

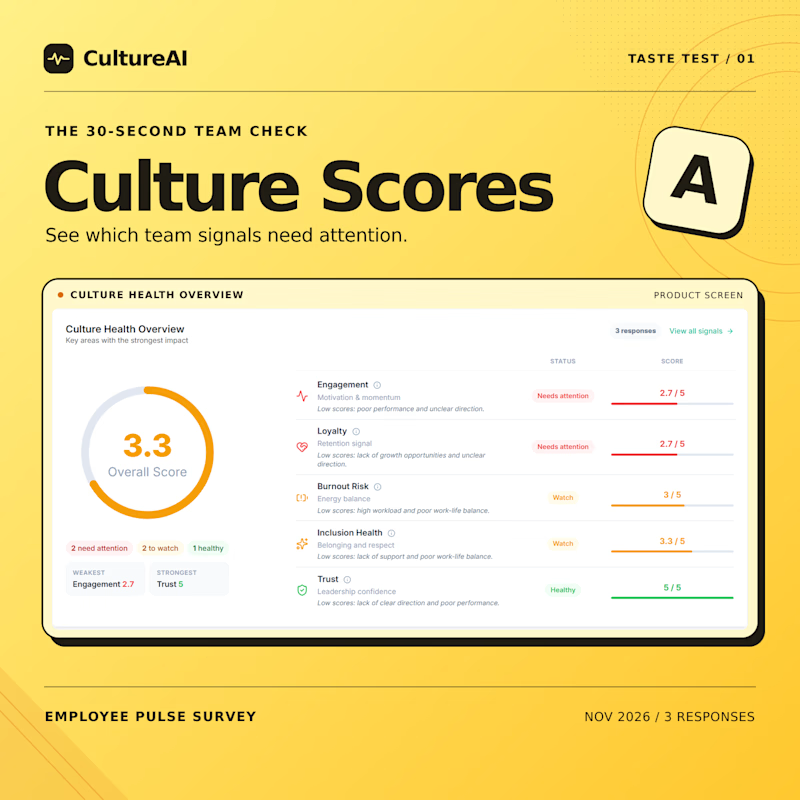
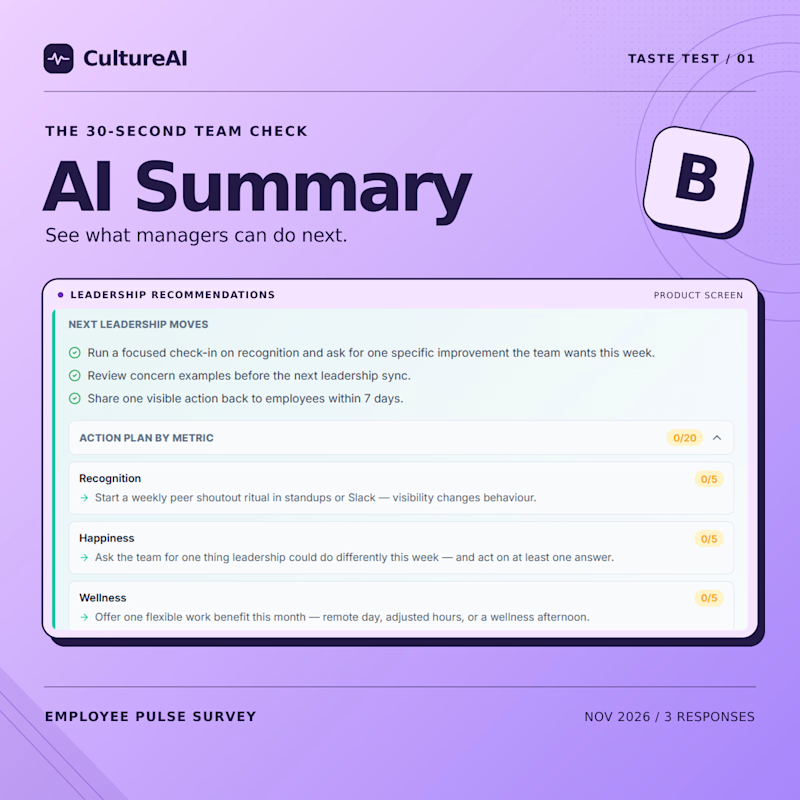
I built both views into CultureAI. If you had 30 seconds before a team meeting, would you check the culture scores 📊 or the AI summary ✨ first?
🌐 Try both views in CultureAI.
2 voted
100%
0 voted
0%
2 votes
Closed

Nice to see both views together.

The board meeting is at nine. It's 8:47, and the numbers aren't ready.
This is a spec ad for Claude Dashboards. The story fits in twelve minutes: scattered data, a spreadsheet that breaks, then one question to Claude and a live dashboard that builds itself. By 8:59, you're ready.
I wanted it to feel like Claude: calm, warm, no hype. Soft easing, a lot of space, and a voiceover that says exactly what's on screen.
Script, storyboard, animation and sound design by me. Every interface rebuilt from scratch in After Effects.
Concept piece, not affiliated with Anthropic.

