The network for creativity
Join 1.25M professional creatives like you
Connect with clients, get discovered, and run your business 100% commission-free
Creatives on Contra have earned over $150M and we are just getting started
Back to feedPost

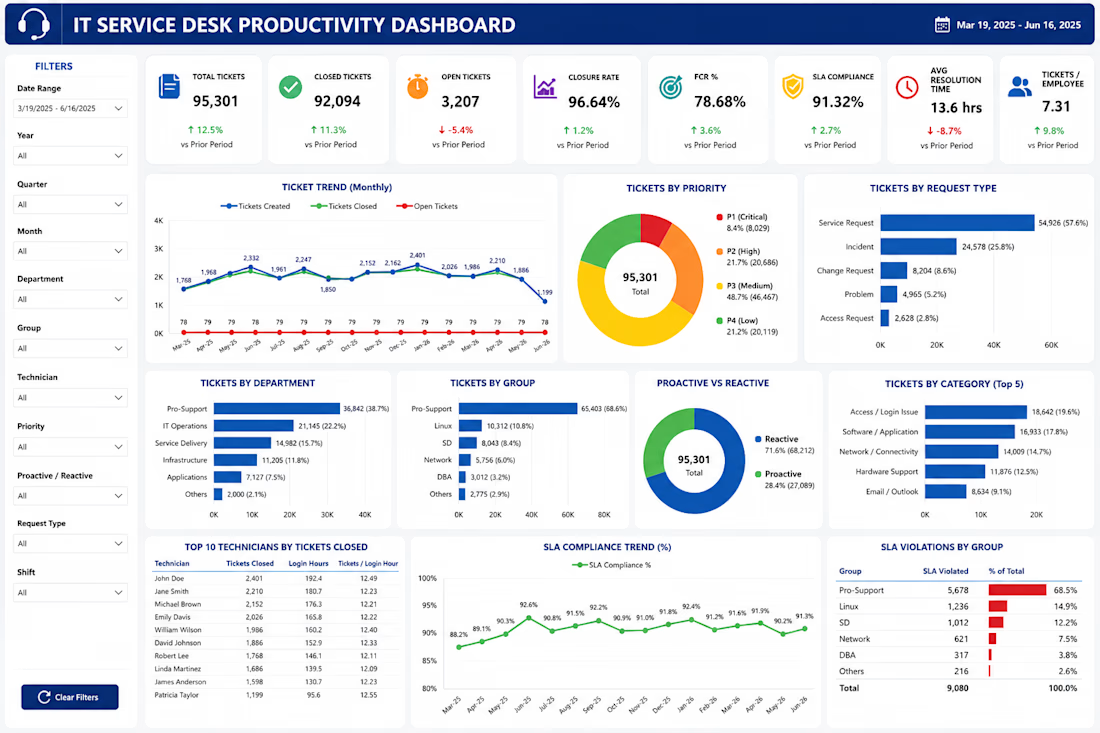
IT Service Desk Productivity Dashboard — Power BI


The network for creativity
Join 1.25M professional creatives like you
Connect with clients, get discovered, and run your business 100% commission-free
Creatives on Contra have earned over $150M and we are just getting started




Related posts

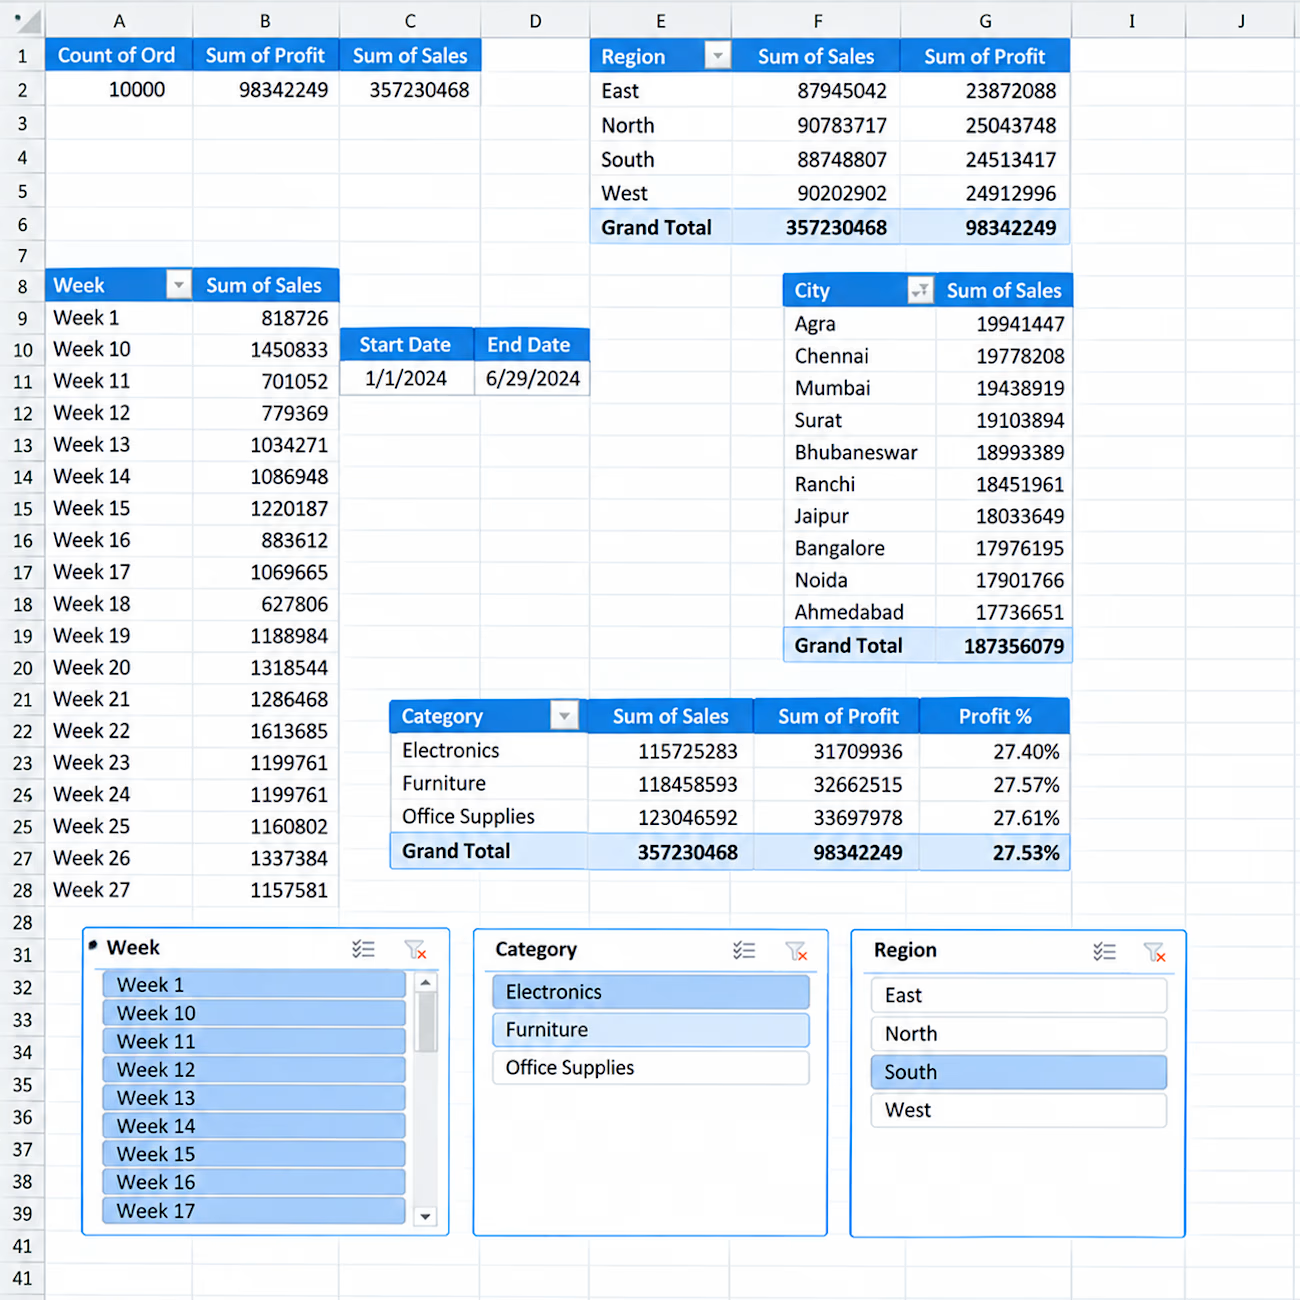
📊 Interactive Sales Analytics Dashboard in Excel
I created an interactive Excel dashboard to analyze sales performance across different business dimensions.
Key Insights & Features:
• Total Orders, Sales & Profit KPIs
• Sales & Profit by Region
• Sales by City
• Category-wise Sales, Profit & Profit %
• Weekly Sales Analysis
• Interactive Slicers for Week, Category & Region
• Start Date & End Date tracking
• PivotTable-based analysis
This dashboard is designed to turn raw sales data into clear and actionable business insights using Excel.


Hello.
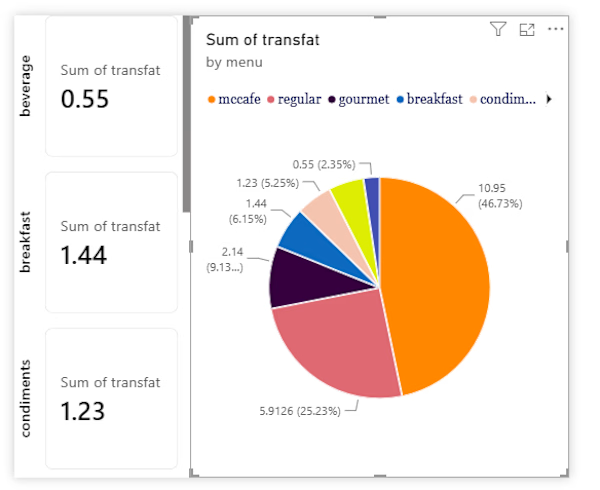
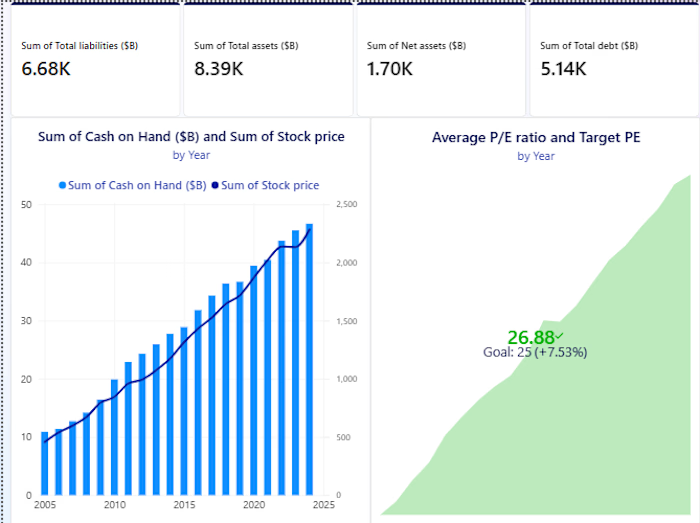
I guess we're in the same page about data analysis and visualization

Energy communities need to manage a lot at once: consumption, generation, members, billing, reports, alerts, and operational changes.
Wattbank explores a clearer SaaS dashboard experience for energy community operators. The interface brings key metrics, energy balancing, participant distribution, billing, reporting, and insights into one workspace that is easy to scan and act on.
The goal was to move away from heavy energy software and create something more visual, human, and operationally useful.


AI Data Assistant Inside Tableau
I built an AI-powered chatbot for Tableau that allows users to interact with their existing dashboards and data through natural-language questions.
Instead of manually navigating through multiple Tableau workbooks to find a specific metric or insight, users can ask the assistant what they need and receive relevant information from the available Tableau data and dashboards.
The solution adds a conversational AI layer directly to the existing BI workflow, helping users explore their data and find the right dashboard or report without changing how their Tableau environment is structured.


Can this system work outside Tableau? I think a client of mine would appreciate this