The network for creativity
Join 1.25M professional creatives like you
Connect with clients, get discovered, and run your business 100% commission-free
Creatives on Contra have earned over $150M and we are just getting started
Back to feedPost

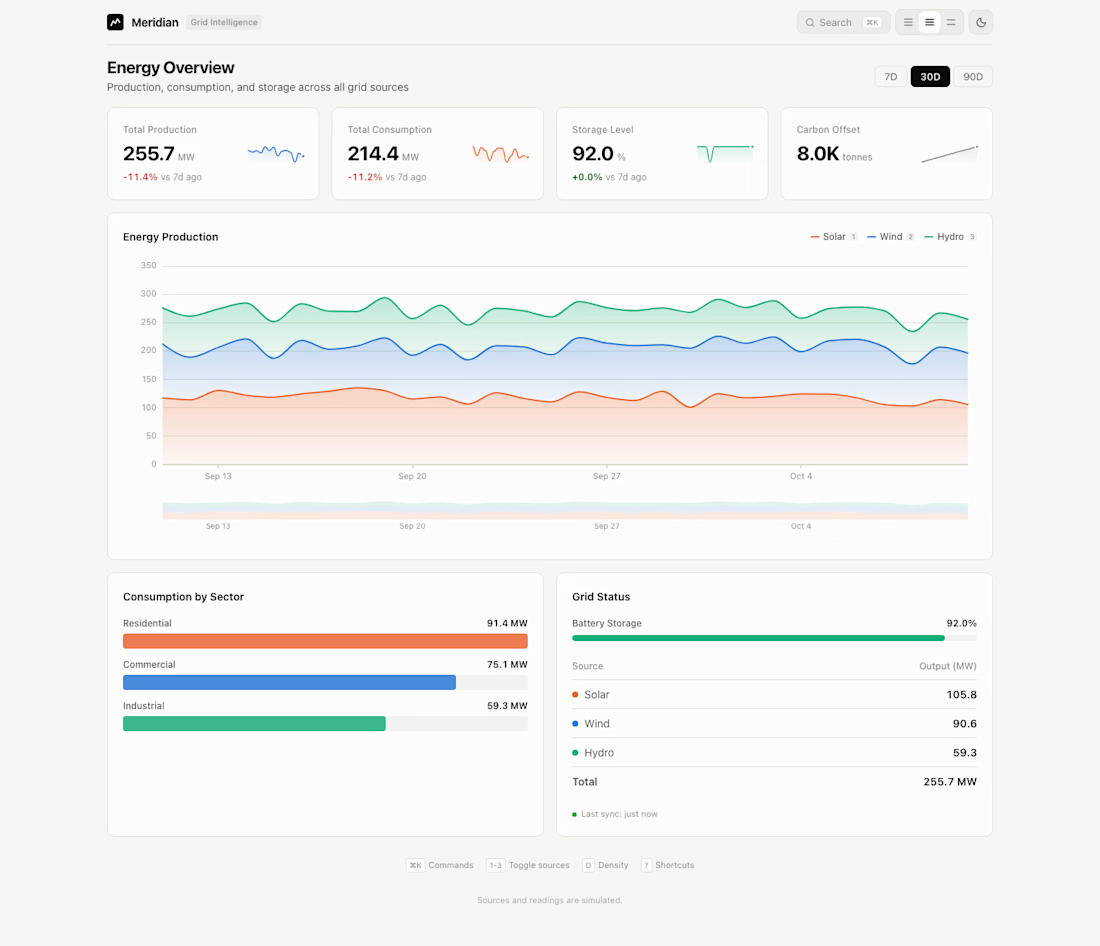
The hard part was density. Ops people want everything on screen, everyone else wants air. So I made it a setting: compact, comfortable, spacious.
Meridian is a fictional energy grid analytics dashboard. One page, four stat tiles with sparklines, and a stacked area chart for three source types (solar, wind, hydro). The command palette (cmd-k) switches density, theme and the source filter. Brush zoom pulls a single week out of 90 days.
Charts are plain SVG; there's no off-the-shelf chart library. Readings are simulated. The site doesn't hide it.
Compact, comfortable or spacious: which would you ship as the default?
The network for creativity
Join 1.25M professional creatives like you
Connect with clients, get discovered, and run your business 100% commission-free
Creatives on Contra have earned over $150M and we are just getting started








Related posts

sentences
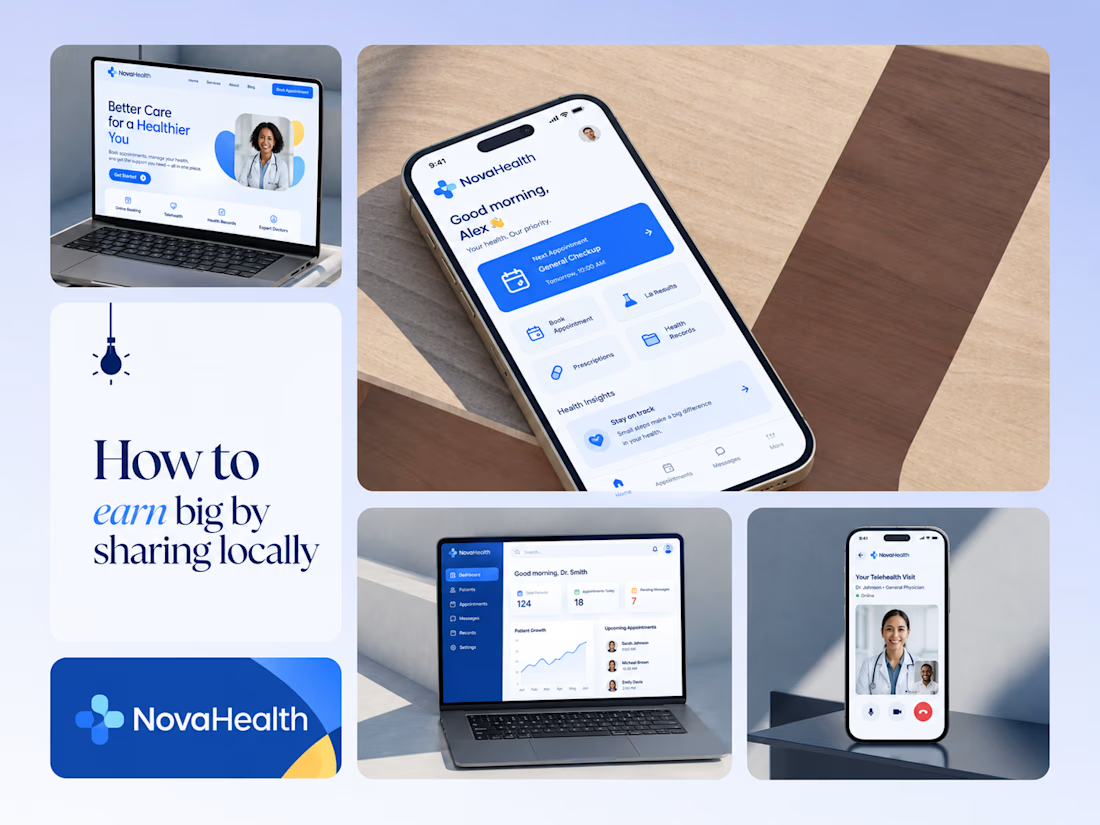
One brand, three screens: patient, doctor, and the video call between them.
NovaHealth is a healthcare brand and product system I designed from logo to apps. Healthcare software tends to feel either cold and clinical or too cluttered to open. I wanted something calm for a worried patient and quick for a doctor between appointments.
The logo breaks the classic medical cross into soft, rounded blocks in two blues, so it reads as “health” without feeling sterile.
The patient app opens with one thing: a solid blue card showing your next appointment. It’s the only fully saturated block on the screen, so nothing competes with it.
The doctor dashboard is built for a glance. Total patients, today’s appointments, and pending messages come first, in the same blue and rounded style as the patient app.
The telehealth screen has almost no UI. The doctor’s face fills the screen, with just three controls: mic, camera, and a red end-call button, the only red in the whole system.
One rule ties it together: blue means action, white space means calm, and yellow is a small spark of warmth.
Which screen should I break down next? 👇



Great medical brand design specially the phone app UI and top left laptop dashboard 🔥🔥🔥
great job Joshua ❤️🎉

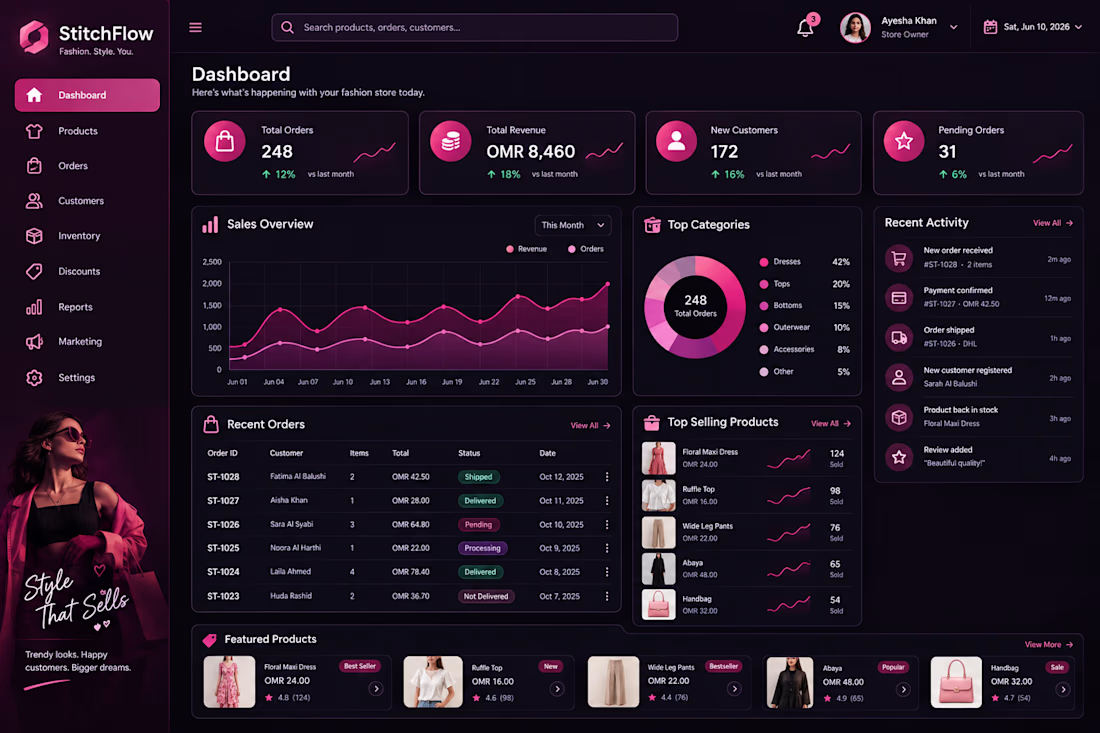
Stitch Flow — Women’s Fashion Dashboard UI Design 🎨
What do you think of the design? I’d love to hear your honest opinion and suggestions! 💗

That's really fulfilling design it has all you need but it needs to be more minimalistic ❤️
Great job Abi🎉🎉🎉

NOVA is a self-initiated concept project: a one-page website for a fictional creative studio, built to show how motion and interaction can make a site feel premium without heavy frameworks.
What I built:
A live WebGL (GLSL) shader background that flows with the mouse and dims as you scroll to keep text readable
Animated loader and word-by-word headline reveals
A fullscreen navigation menu with a circular clip-path reveal
A scroll-lit paragraph where each word highlights as you scroll
A project list with a floating preview card that follows the cursor
Stacking service cards using sticky positioning and scroll-scrubbed scaling
Custom blend-mode cursor, magnetic button, animated counters, scroll progress bar and live studio clock
Fully responsive layout with a light/dark colour scheme and reduced-motion support
Tech stack: HTML5, CSS3, vanilla JavaScript, GSAP + ScrollTrigger, Lenis smooth scroll, Three.js (GLSL shaders).
Focus: smooth 60fps animation, clean code, mobile-friendly design and fast loading, with no React or other heavy framework.

