The network for creativity
Join 1.25M professional creatives like you
Connect with clients, get discovered, and run your business 100% commission-free
Creatives on Contra have earned over $150M and we are just getting started
Back to feedPost
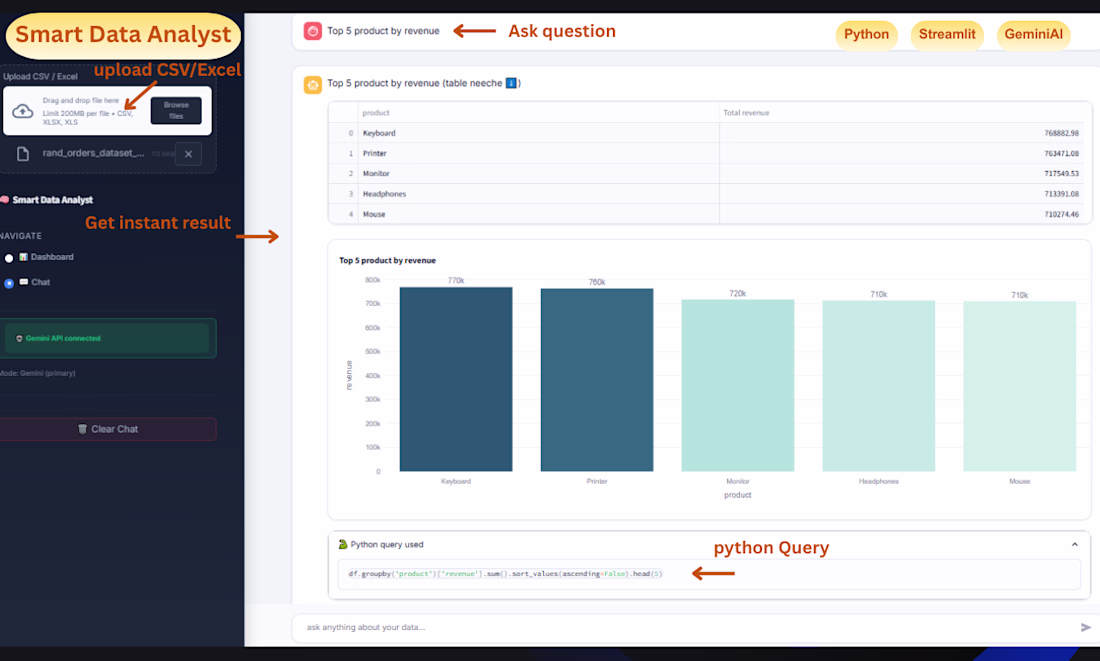
I built a tool that reads your data and tells you what's actually going on.
Upload a CSV or Excel file → it gives you KPIs, auto-generated charts, and a PDF report. You can also ask it questions in plain English like "which product had the highest return rate last month?" and it answers instantly.
No coding needed on your end. No manual chart-building. Just upload and get answers.
I've been using it with e-commerce and marketing datasets mostly, but it works with any structured data.
If you have a dataset sitting around that you haven't had time to analyze — drop a comment or DM me. Happy to run it through and show you what comes out.
The network for creativity
Join 1.25M professional creatives like you
Connect with clients, get discovered, and run your business 100% commission-free
Creatives on Contra have earned over $150M and we are just getting started
Related posts
In this design, we simplified how businesses scale with automation by combining live performance analytics, strategic AI integrations, and bold data visualization into a single, ultra-clean interface. Featuring an elegant dark-to-light transition, intuitive bento-inspired layouts, and high-contrast typography, complex operational data feels effortless to explore and act on.
📩 Collaborate with Us? Contra Cansaas Agency

Drop & Explain — turn messy data into clear answers, instantly.
The problem: small business owners have data but no time and no money for an analyst, so their numbers go unused.
My solution: drop in a spreadsheet and instantly get clean charts plus a plain-language breakdown of what's happening and what to do next — and it all runs in your browser, so your data stays private.
Built entirely with Figma Make.
#configmakeathon @figma
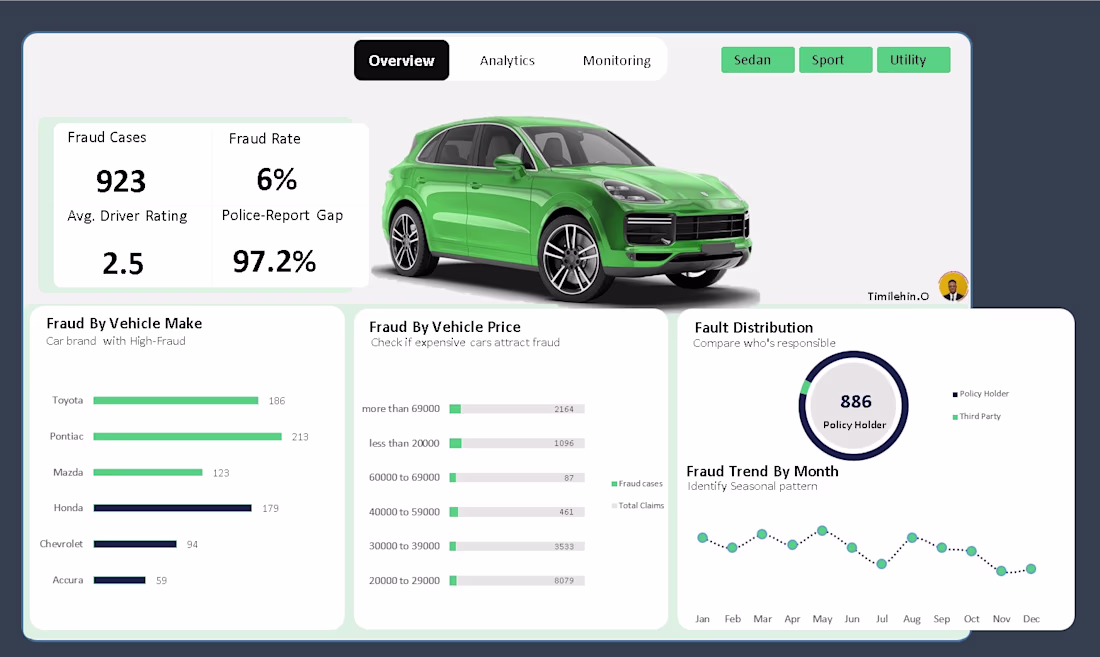
Fraud doesn’t always look suspicious, until you analyse the patterns.
I recently worked on a Vehicle Insurance Claim Fraud Analysis case study where the goal was simple:
👉 identify hidden risk signals and process gaps that allow fraudulent claims to slip through.
🔍 The problem
Insurance teams deal with thousands of claims, but:
• Fraud is often buried inside normal-looking transactions
• Manual checks miss systemic weaknesses, not just bad actors
• High-risk signals are rarely quantified clearly
So I approached this as a real-world fraud analyst, not just a dashboard exercise.
🛠️ What I did (end-to-end)
Using Excel analysis, I:
• Cleaned and structured claim-level data
• Defined fraud-focused KPIs, not vanity metrics
• Built an interactive dashboard with slicers to simulate decision-making
📊 Core KPIs tracked
• Fraud Rate (%)
• Total Fraud Cases
• Average Driver Risk Rating (Fraud)
• Police Report Gap (%) - fraud claims filed without police reports
🚨 Key insights discovered
• Fraud concentration varied strongly by vehicle price band, not just volume
• Certain vehicle categories consistently showed higher fraud exposure
• An alarming 97%+ of fraudulent claims lacked police reports, highlighting a major verification gap
• Driver risk ratings provided early signals that could support preventive controls
These insights aren’t theoretical, they point directly to where insurers are leaking money.
💡 Business impact (how this helps)
This type of analysis helps organisations:
• Flag high-risk claims earlier
• Strengthen fraud prevention rules
• Improve compliance and documentation checks
• Reduce payout losses without increasing manual workload
🧠 Tools & skills applied
Excel (Advanced Pivot Analysis)
Fraud & Risk Analytics
Dashboard Storytelling
Business Intelligence Thinking
I’m building and sharing real fraud analytics case studies as I continue to grow in this space, focusing on credit card, insurance, and transaction fraud.
If you’re a:
• Fraud / Risk Manager
• Insurance or FinTech team
• Founder needing data-driven fraud insights
I’m open to conversations and collaboration.
#FraudAnalytics #FraudDetection #RiskAnalytics #BusinessIntelligence #ExcelDashboard #DataAnalytics #BuildInPublic
wow this is very insightful
Challenges
View allTrending
Claude
Claude has entered the design space. How are you using Claude Design?
Contra University
Learn from expert creatives how to earn more using next-gen AI tools.
MagicPath
The canvas is infinite, and exploration is becoming the workflow. How are you using MagicPath?
creativeaiflow
Creative AI workflows are evolving. What tools do you use, and what are their strengths and weaknesses?
freelancerlife
Freelancer life is wins, pivots, and everything in between. What’s yours right now?