The network for creativity
Join 1.25M professional creatives like you
Connect with clients, get discovered, and run your business 100% commission-free
Creatives on Contra have earned over $150M and we are just getting started
Back to feedPost

A dashboard should answer a business question at a glance.
I build Power BI KPI dashboards that bring key metrics into one clear, interactive view—so teams can explore performance, spot changes, and ask better follow-up questions.
A typical dashboard project includes:
• A short discovery step to define users, decisions, and KPIs
• Data shaping and a documented model based on the agreed sources
• Interactive report pages with clear filters and visual hierarchy
• KPI definitions and notes on assumptions or data limitations
• A handoff walkthrough so your team knows how to use the report
The result is a decision-support dashboard tailored to your workflow, not a collection of charts without context.
If you have a reporting challenge, share the data sources and the questions your current reports do not answer.
The network for creativity
Join 1.25M professional creatives like you
Connect with clients, get discovered, and run your business 100% commission-free
Creatives on Contra have earned over $150M and we are just getting started






Related posts

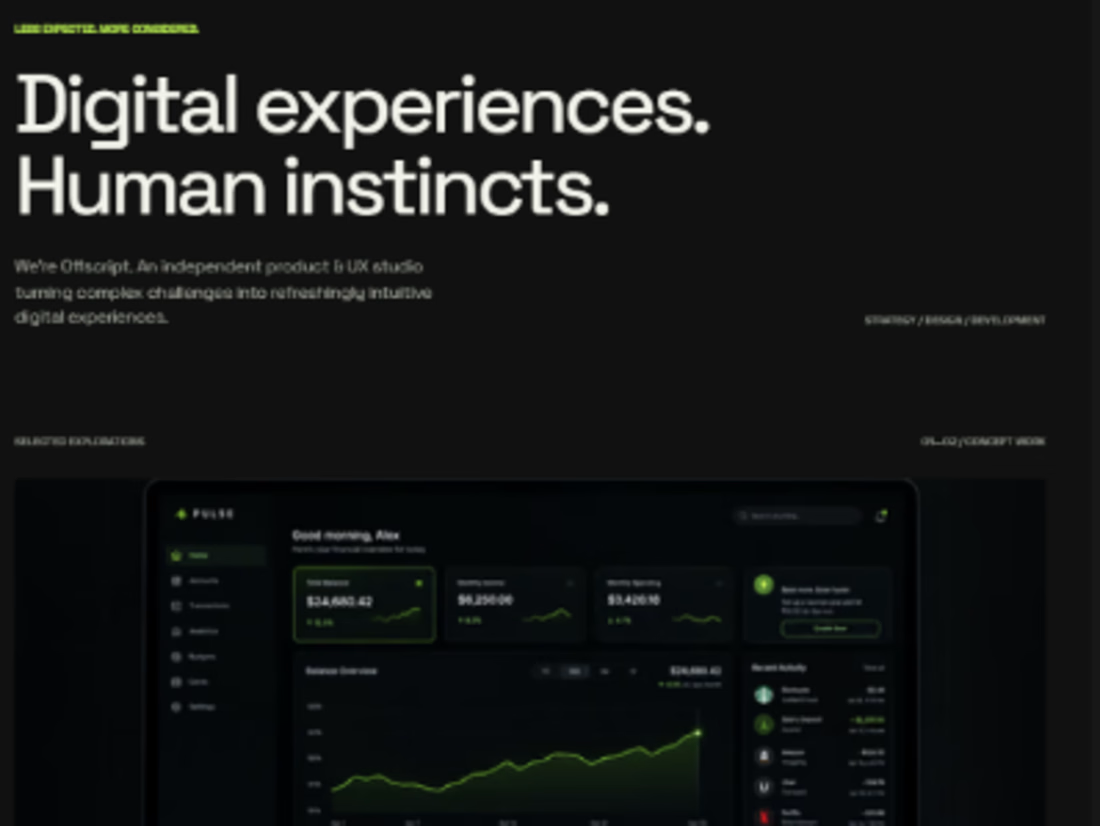
Designed a modern finance dashboard to help users track income, expenses, saving and financial activity with a clean and intuitive interface


A cleaner dashboard can sometimes be a slower dashboard.
Especially when it's designed for people who work with complex information every day.
Imagine a financial analyst reviewing hundreds of transactions.
They need to compare data, identify exceptions, apply filters, and move between different records throughout the day.
Now imagine simplifying that interface by hiding most of the information behind expandable sections, secondary menus, and separate pages.
The result might look considerably cleaner.
But the analyst now needs more interactions to access information that was previously available at a glance.
And when those actions are repeated dozens of times a day, the difference becomes significant.
This is something I find particularly interesting about designing for experienced users.
There's a distinction between an interface that's unnecessarily complicated and one that supports genuinely complex work.
Data density isn't automatically a usability problem.
Neither are advanced controls, detailed tables, or multiple pieces of information displayed together.
Sometimes they're exactly what makes a professional tool efficient.
Of course, that doesn't justify cluttered interfaces or poorly organized information.
The challenge is understanding what needs to remain visible, what can be progressively disclosed, and where customization or saved views might help different users work more effectively.
A first-time user may benefit from additional guidance and a more focused experience.
Someone who has been using the product every day for years may value direct access, shortcuts, and the ability to work without unnecessary interruptions.
Both perspectives matter.
But designing for experts means understanding their workflows well enough to know which complexity serves a purpose.
Sometimes simplifying an experience isn't about removing information.
It's about removing the effort required to work with it.

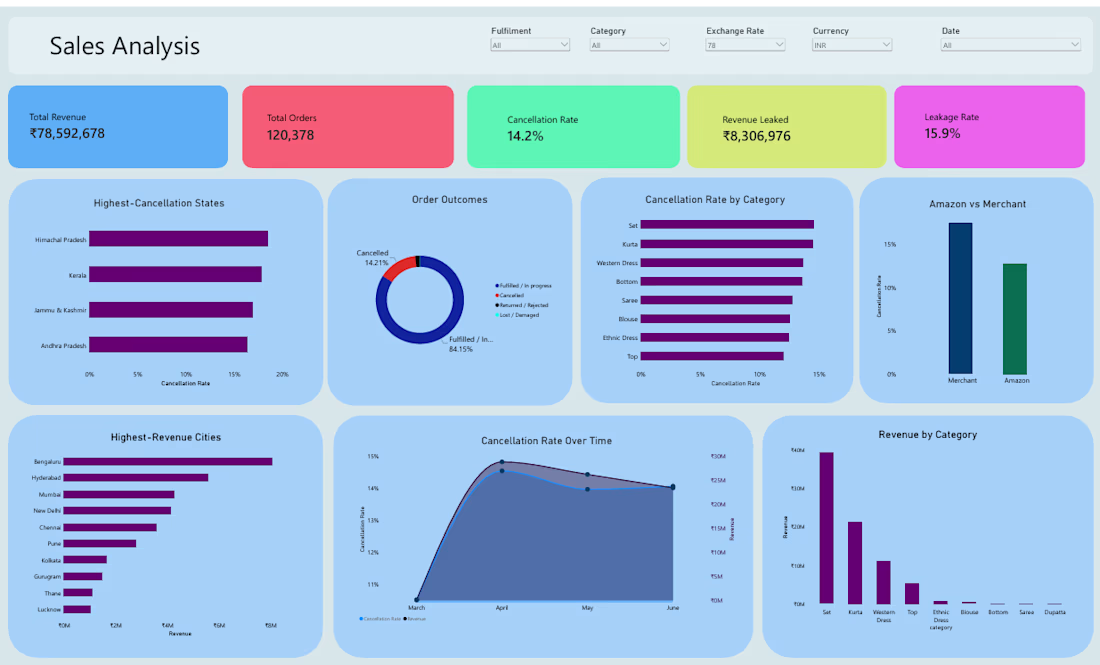
A seller can have thousands of orders and still not keep the revenue. I analyzed 120,378 Amazon orders to find where it leaks and built a Power BI dashboard to show it.
Key findings: 14.2% of order lines were cancelled and total leakage reached 15.9%. Merchant-fulfilled orders cancelled more often than Amazon-fulfilled ones, and "Set" is both the top revenue category and the most cancelled.
Built with Python (cleaning), MySQL (analysis) and Power BI (interactive dashboard with INR/USD switch).