The network for creativity
Join 1.25M professional creatives like you
Connect with clients, get discovered, and run your business 100% commission-free
Creatives on Contra have earned over $150M and we are just getting started
Back to feedPost
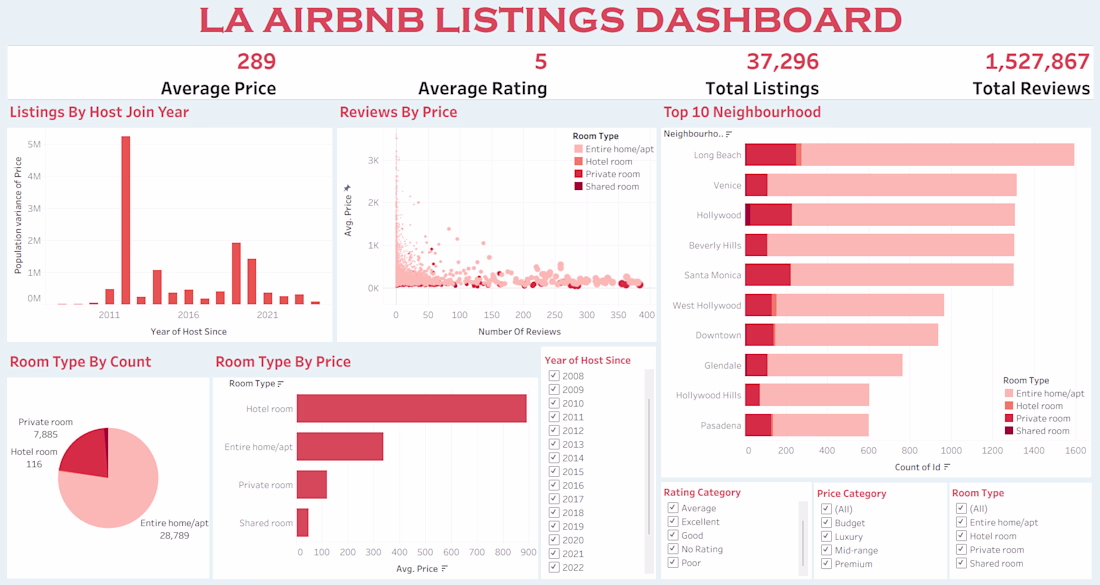
LA has thousands of Airbnb listings, but what actually drives pricing, reviews, and listing concentration across neighbourhoods?
I explored this by building an interactive LA Airbnb Listings Dashboard focused on market patterns, host activity, and customer engagement.
The goal was not just to visualize data, but to understand what drives listing performance and market behavior in the Airbnb ecosystem.
Problem Explored:
Airbnb markets are influenced by multiple operational and customer-driven factors such as pricing, room type, host experience, and review activity.
This dashboard was designed to transform raw listing data into actionable market insights.
Tools & Workflow:
• Tableau for dashboard design and interactive analytics
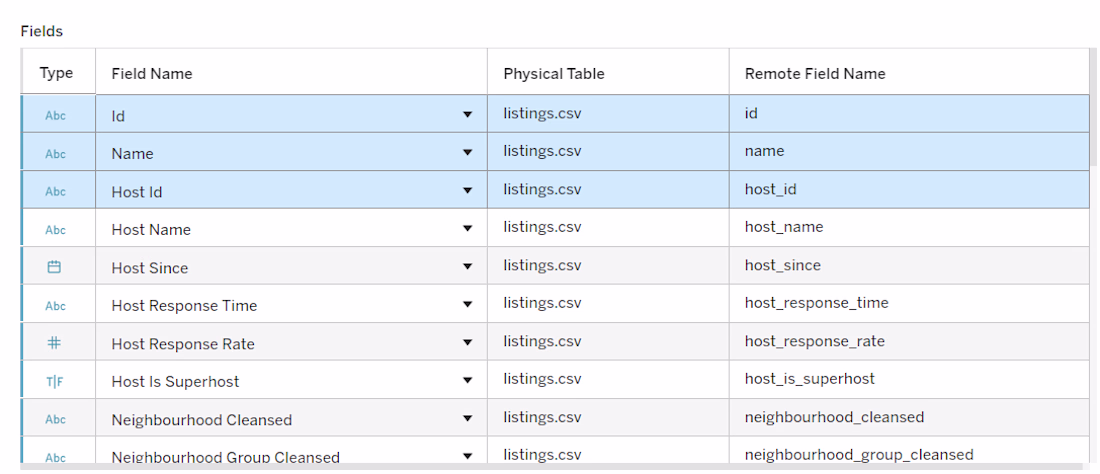
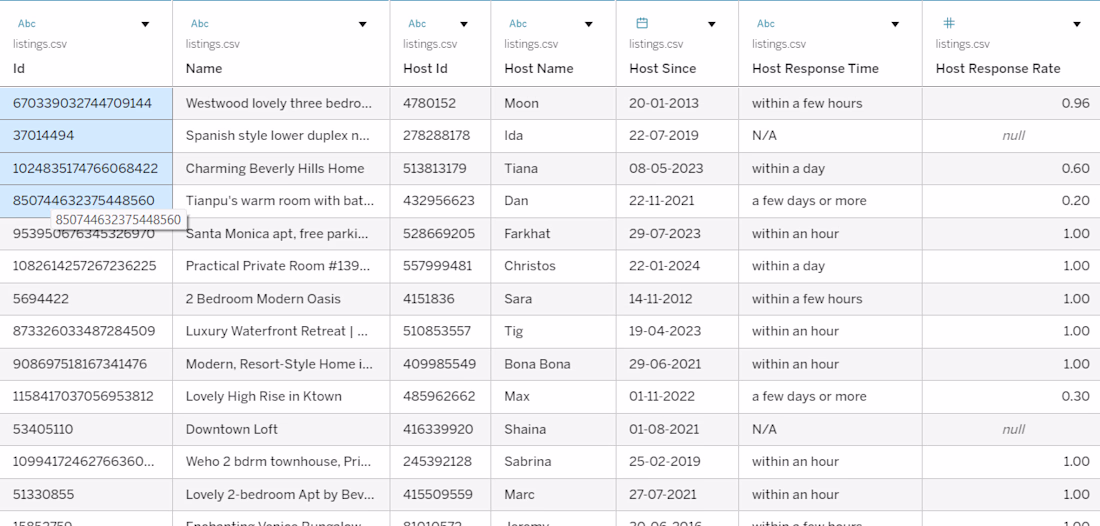
• Data preparation and field structuring using listing-level datasets
• KPI tracking and filter-driven exploration
• Multi-dimensional analysis across pricing, reviews, room types, and neighbourhoods
Key Insights Identified:
• Entire home or apartment listings dominate LA Airbnb inventory
• Premium neighbourhoods showed significantly higher pricing patterns
• Host onboarding periods revealed noticeable listing concentration trends
• Review volume and pricing displayed varying engagement patterns across room categories
Dashboard Features:
Interactive filters
KPI cards
Neighbourhood analysis
Pricing segmentation
Host and review analysis
Room-type comparison
The network for creativity
Join 1.25M professional creatives like you
Connect with clients, get discovered, and run your business 100% commission-free
Creatives on Contra have earned over $150M and we are just getting started
Related posts
I turn raw data into clear, visual dashboards that help businesses make better decisions.
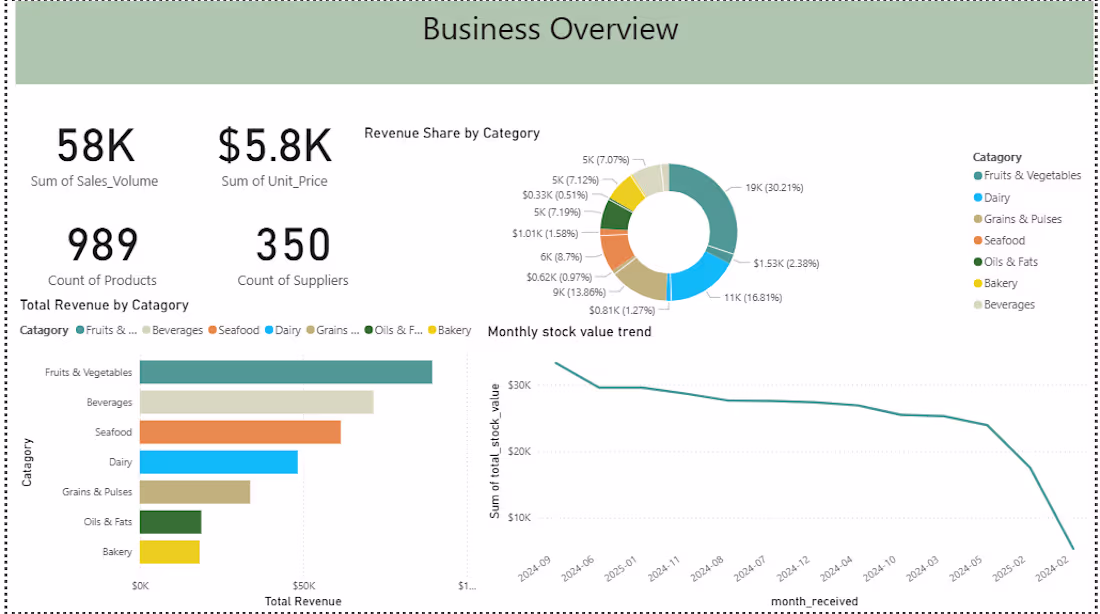
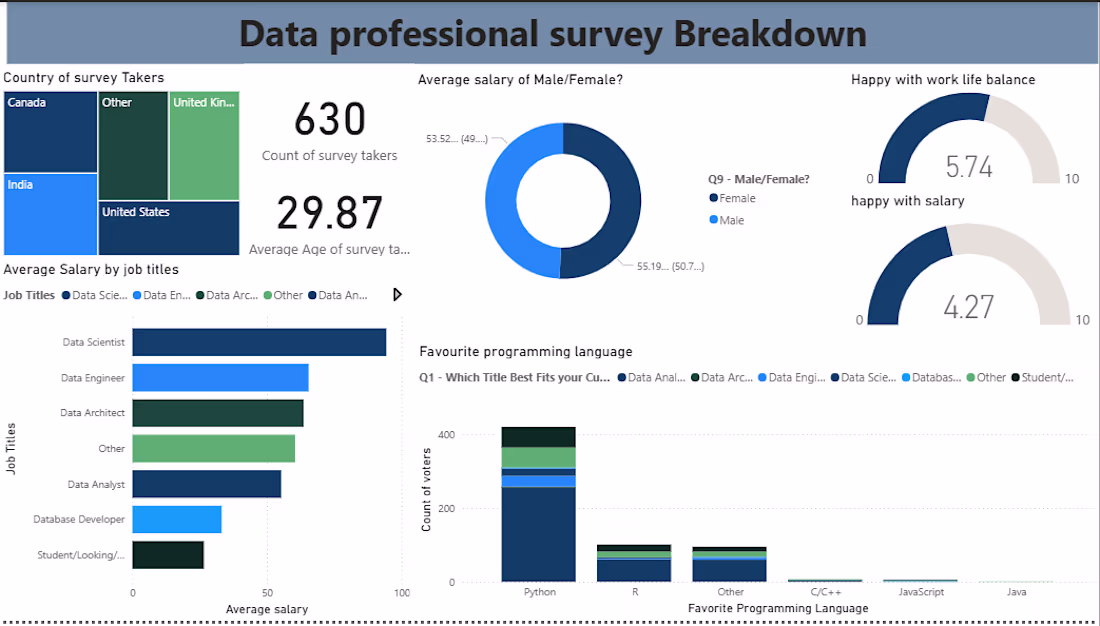
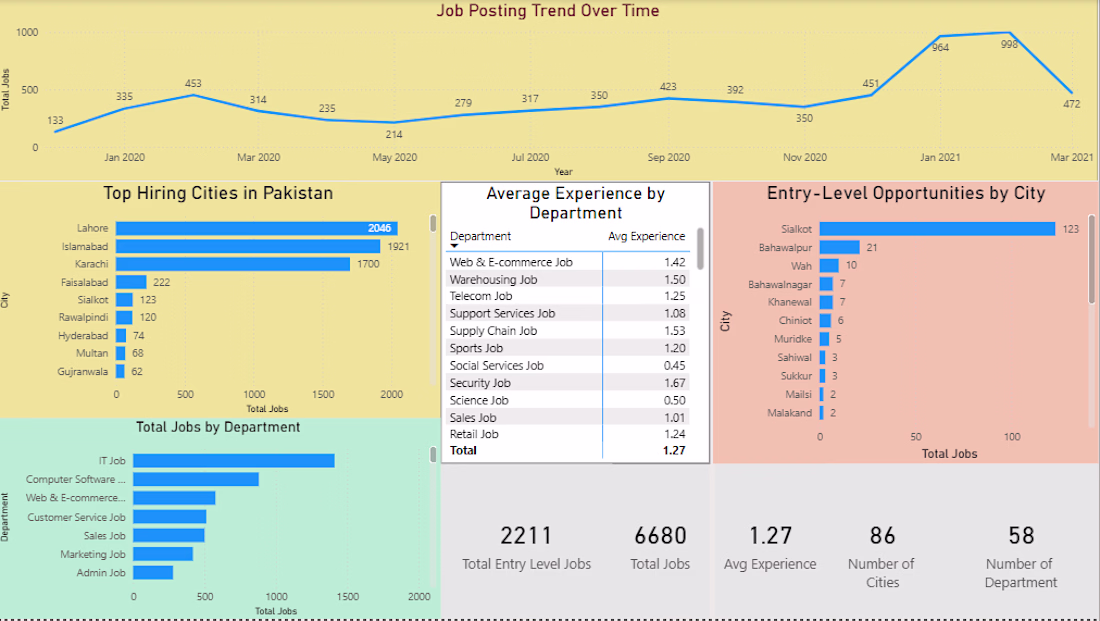
I have built dashboards analyzing 6,680 job postings across Pakistan, surveyed 630 data professionals worldwide, and tracked inventory and revenue trends across product categories — all using Power BI, Python, and Excel.
If you have data sitting in spreadsheets that you don't know what to do with, I will turn it into something you can actually use.
First project is completely free. Let's talk.
Crafted a professional real estate social media creative to enhance brand visibility and audience engagement.

Great
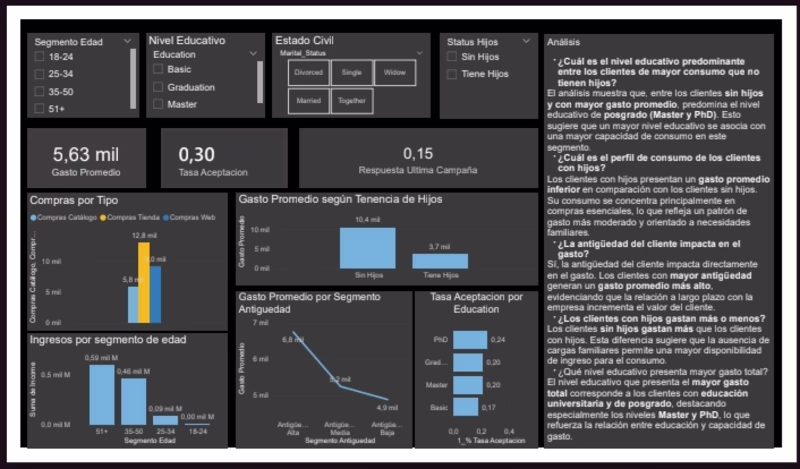
📈 Customer Purchase Behavior Dashboard: Key insights on audience segmentation and campaign conversion
Trending
Claude
Claude has entered the design space. How are you using Claude Design?
Contra University
Learn from expert creatives how to earn more using next-gen AI tools.
creativeaiflow
Creative AI workflows are evolving. What tools do you use, and what are their strengths and weaknesses?
portfolioreview
The best portfolios tell a story, not just show a grid. Share yours for feedback.
freelancerlife
Freelancer life is wins, pivots, and everything in between. What’s yours right now?