The network for creativity
Join 1.25M professional creatives like you
Connect with clients, get discovered, and run your business 100% commission-free
Creatives on Contra have earned over $150M and we are just getting started
Back to feedPost

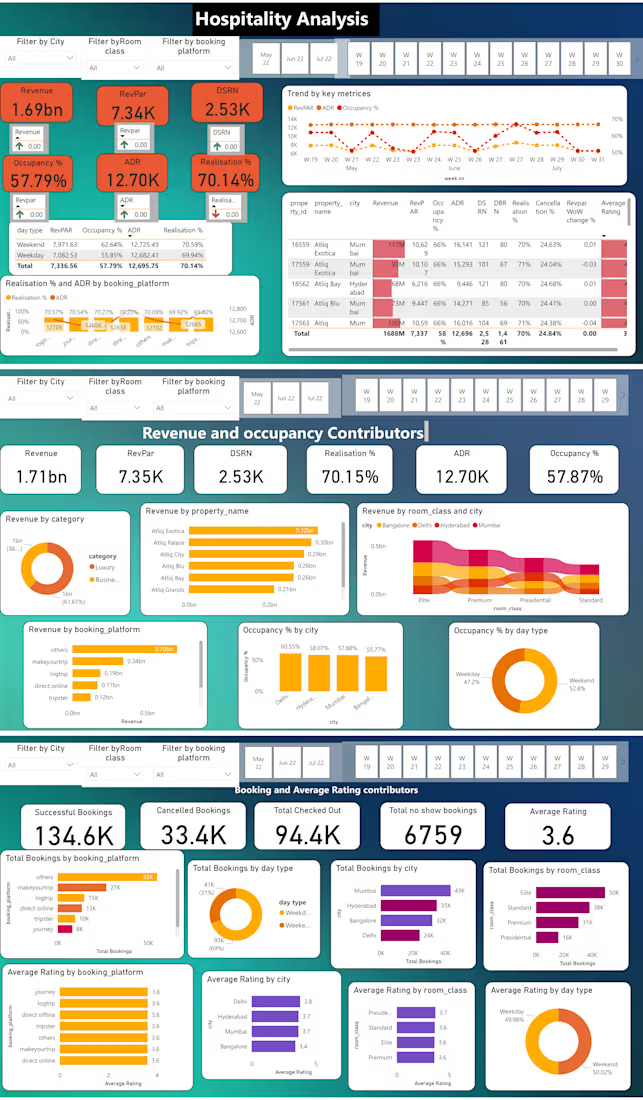
I will transform your raw Excel data into a clean, interactive Power BI dashboard that makes important business metrics easy to understand. I can clean and structure your data, create KPIs, analyze trends, and build clear visualizations with filters and slicers. The dashboard will be designed to help you quickly monitor performance and make data-driven decisions.


The network for creativity
Join 1.25M professional creatives like you
Connect with clients, get discovered, and run your business 100% commission-free
Creatives on Contra have earned over $150M and we are just getting started








Related posts

Revlane Revenue: SaaS Dashboard Animation (Concept)
A concept animation for Revlane, a fictional revenue dashboard. The KPIs count up, the week's bars rise, and a trend line draws across. A "New record" toast slides in and the camera pushes in on the numbers. Then the cursor clicks Sunday's bar to open its value, and the view pulls back to the full dashboard.
Made in Jitter with Counter, mask reveals, and Scale and Move for the camera. Custom UI sound. 12-second loop.


Clean design execution, and perfect interaction

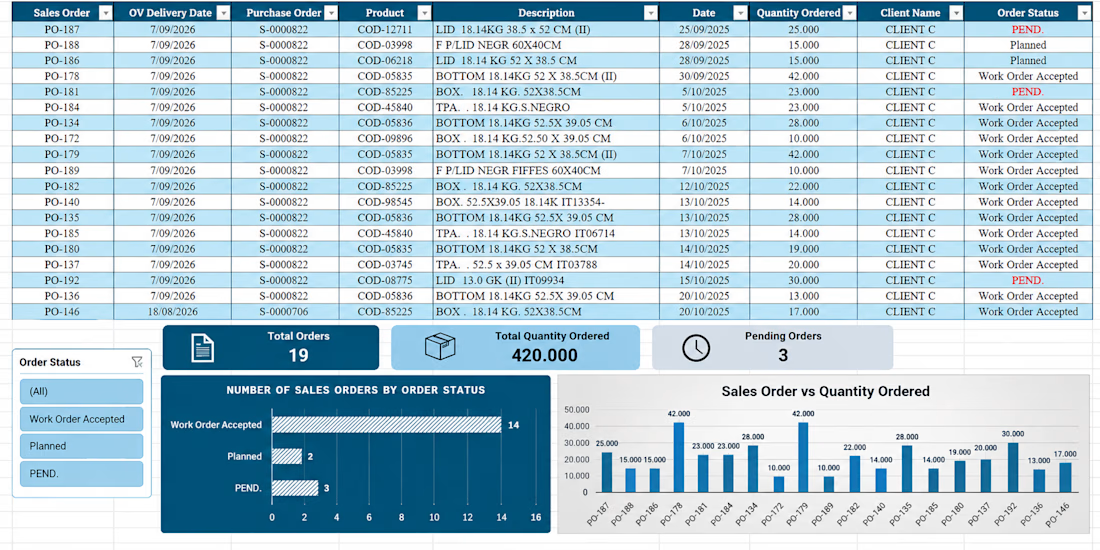
Developed an Excel dashboard for tracking sales orders, organizing order data, monitoring order status, and analyzing requested quantities. The project included data organization, filters, KPI summaries, and visual charts to improve data comprehension and support informed decision-making.

I developed an interactive Power BI Sales Dashboard that transforms raw business data into clear, actionable insights. The project includes data preparation, modeling, relationships, DAX measures, KPI tracking, sales and profit analysis, interactive visuals, slicers, and dynamic filtering. Users can analyze performance by region, product, customer and time, identify trends and monitor key metrics.
My Power BI Analytics Workflow:-
Data Preparation → Modeling → Relationships → DAX → Visualizations → Dashboard → Report Publishing.