The network for creativity
Join 1.25M professional creatives like you
Connect with clients, get discovered, and run your business 100% commission-free
Creatives on Contra have earned over $150M and we are just getting started
Back to feedPost

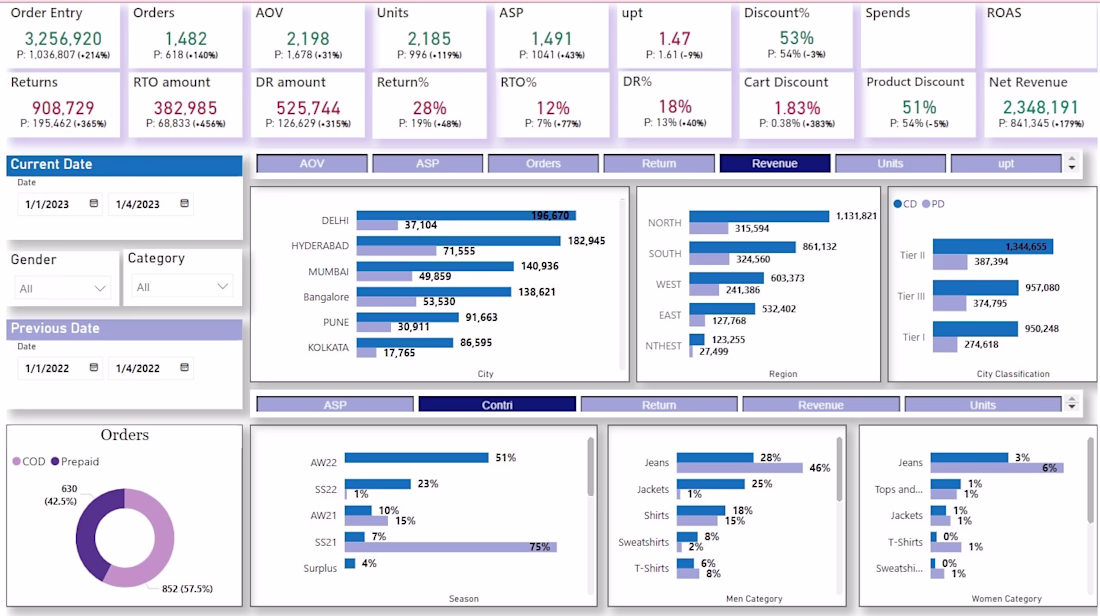
Developed a customized Power BI dashboard to compare performance across different time periods and categories. The dashboard enables users to analyze key metrics such as revenue, orders, returns, and discounts with dynamic filters for region, city, gender, and product categories. It provides clear insights into trends, performance gaps, and business drivers, supporting data-driven decision-making.


The network for creativity
Join 1.25M professional creatives like you
Connect with clients, get discovered, and run your business 100% commission-free
Creatives on Contra have earned over $150M and we are just getting started
Related posts

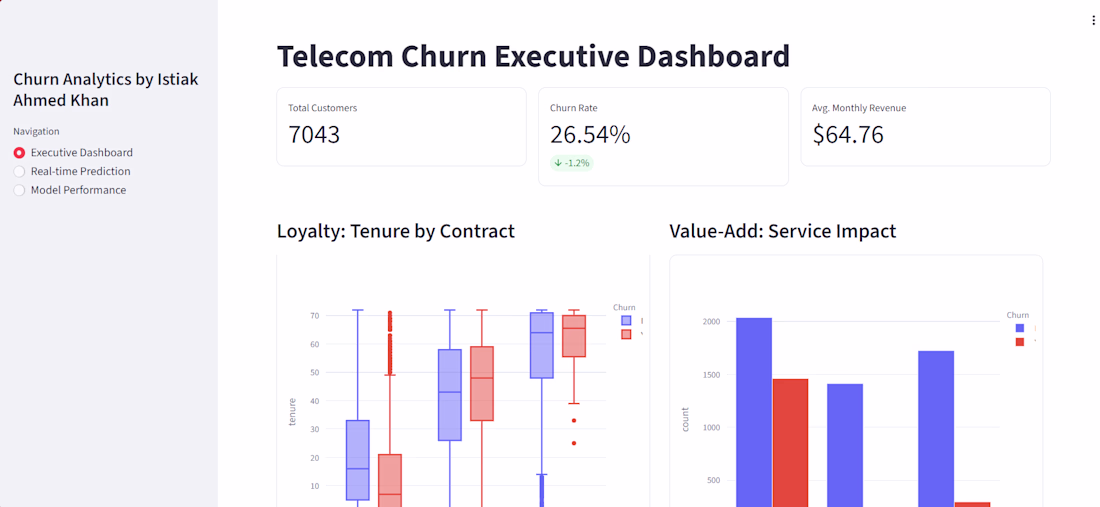
End-to-End Machine Learning Pipeline for Telecom Customer Churn
1. The Business Problem
Customer churn is a major challenge for telecommunications companies, driven by competition, service issues, and changing consumer preferences. This project was designed to transition the company from reactive support to proactive retention using data-driven strategies such as customer segmentation, personalized offers, and loyalty programs,.
2. Data Exploration & Insights (EDA)
I performed a comprehensive descriptive analysis on a database of 7,043 customers with 21 distinct variables,. Key findings included:
Contractual Risk: Customers on month-to-month contracts showed significantly higher churn compared to those on one- or two-year commitments,.
Service Preference: While Fiber Optic plans were the most popular, they also represented a critical segment for monitoring due to their higher price points,.
Financial Indicators: Churned customers had a higher average monthly charge of $74.44, compared to $61.27 for retained customers.
Payment Behavior: The "Electronic Check" payment method was most strongly associated with service cancellation,.
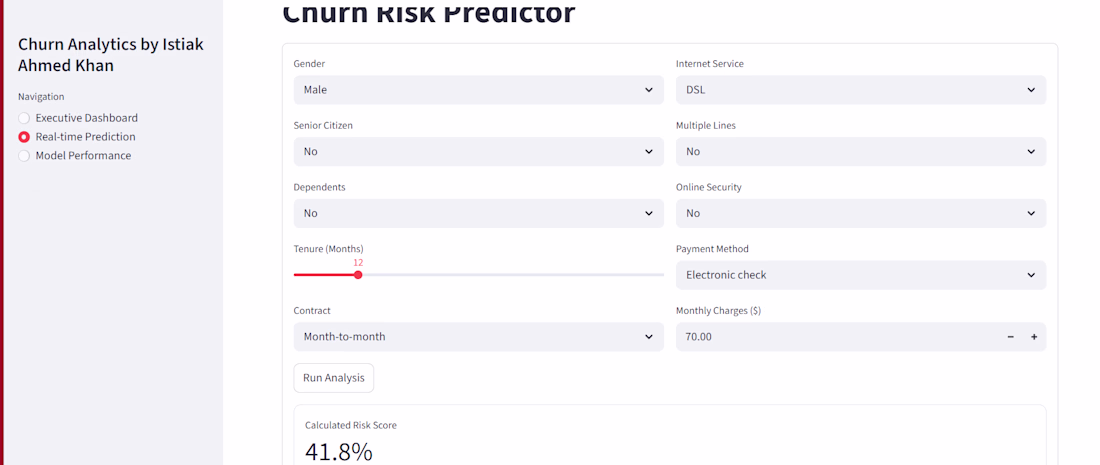
3. Engineering & Preprocessing Pipeline
To prepare the data for high-performance modeling, I implemented a rigorous preprocessing workflow:
Data Cleaning: Removed irrelevant identifiers like customerID and addressed potential data quality issues. The dataset was verified to have zero missing or NaN values,.
Feature Engineering: Applied Label Encoding to transform categorical text variables into a numerical format suitable for machine learning algorithms,.
Data Splitting: Adopted a standard 80/20 train-test split to ensure the model could generalize effectively to unseen data,.
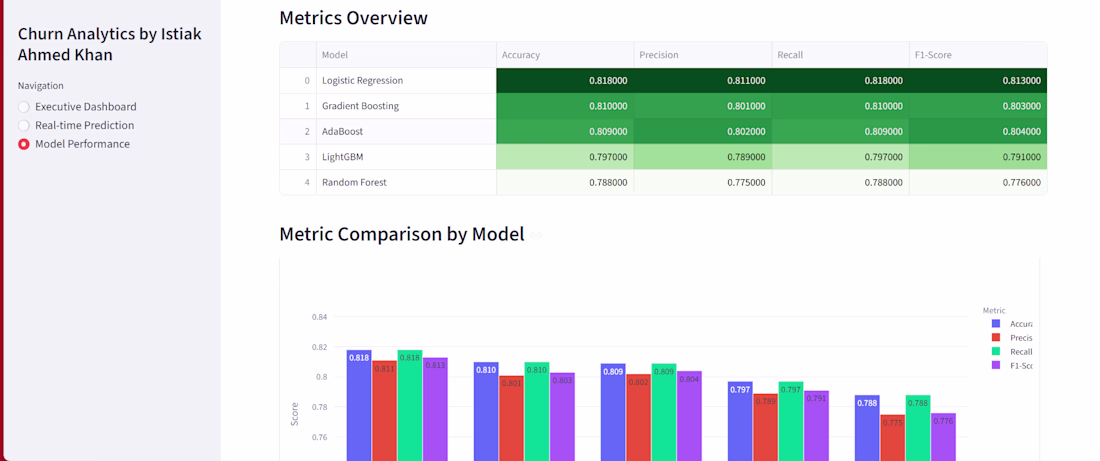
4. Model Development & Benchmarking
I developed and benchmarked eight distinct machine learning algorithms to identify the most effective solution for this specific application:
Linear & Probabilistic: Logistic Regression, Naive Bayes.
Tree-Based: Decision Tree, Random Forest.
Boosting Frameworks: AdaBoost, Gradient Boosting, XGBoost, and LightGBM,.
5. Performance Evaluation & Results
Models were evaluated using ROC curves, confusion matrices, and detailed classification reports,.
Winner: Logistic Regression achieved the highest accuracy at 81.83%,.
Secondary Performers: Gradient Boosting (81.05%) and AdaBoost (80.98%) also showed strong predictive power.
6. Technical Conclusion
This data-driven approach proves that proactive churn prediction is essential for business sustainability. By identifying that customers prioritize high-speed fiber optic services but are sensitive to pricing and contract terms, the company can now optimize its pricing and retention strategies to maximize user satisfaction and revenue.


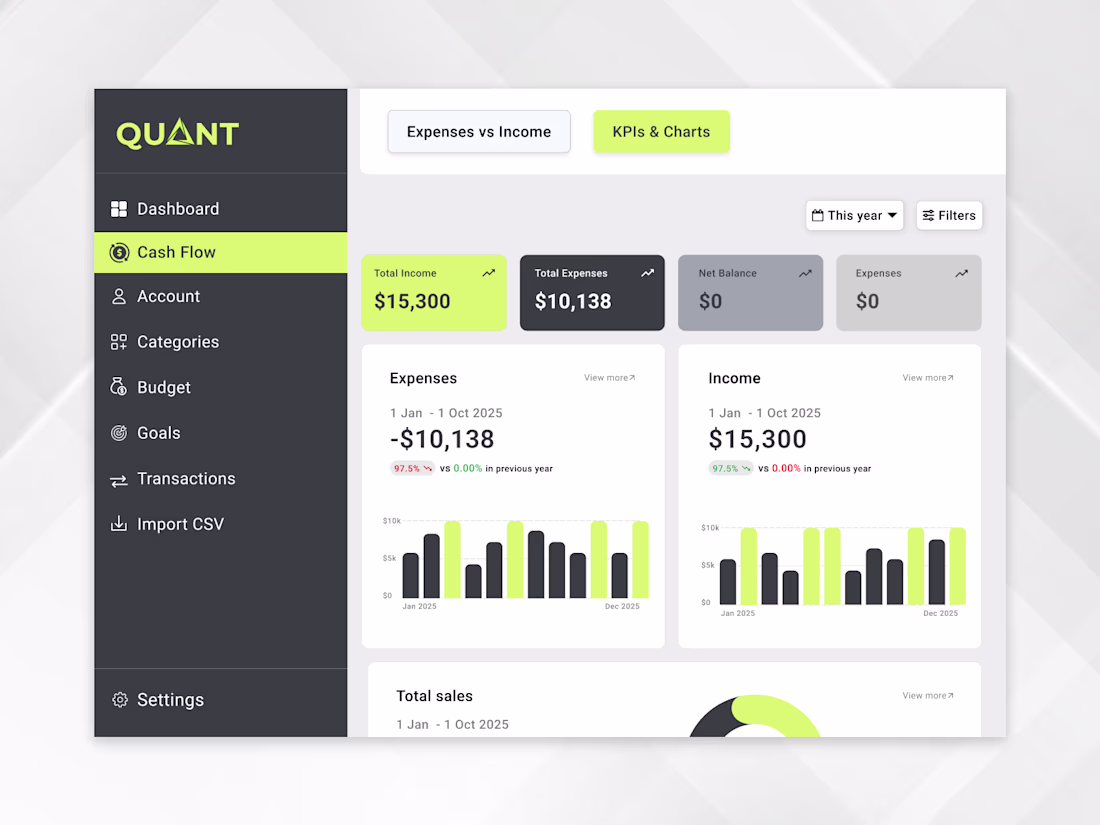
Just finished working on Quant — a modern finance dashboard designed to give users a clear, real-time overview of their income and expenses.
Focused on clean UI, strong UX, and making financial data simple and intuitive to understand. The goal wasn’t just to design something that looks good, but something that actually helps users make better decisions.
Curious to hear your thoughts 👀


Great work.


Trending


Notion
Notion isn’t just where you work, it’s starting to work for you. What agents are you building?
portfolioreview
The best portfolios tell a story, not just show a grid. Share yours for feedback.
brandguidelines
Brand guidelines are becoming living systems, not static documents. What are you building for your clients?
aivideo
AI video tools are moving at warp speed. Which ones are you experimenting with?
freelancerlife
Freelancer life is wins, pivots, and everything in between. What’s yours right now?