The network for creativity
Join 1.25M professional creatives like you
Connect with clients, get discovered, and run your business 100% commission-free
Creatives on Contra have earned over $150M and we are just getting started
Back to feedPost

Designed and developed a dynamic, fully interactive Executive Financial Dashboard for KPK Global Inc. to track historical performance (2015–2017) and project financial trajectories over a 5-year forecast period (2018–2022). The model acts as a single source of truth for executives, translating complex 3-statement financial models into scannable, actionable visual insights.


The network for creativity
Join 1.25M professional creatives like you
Connect with clients, get discovered, and run your business 100% commission-free
Creatives on Contra have earned over $150M and we are just getting started











Related posts

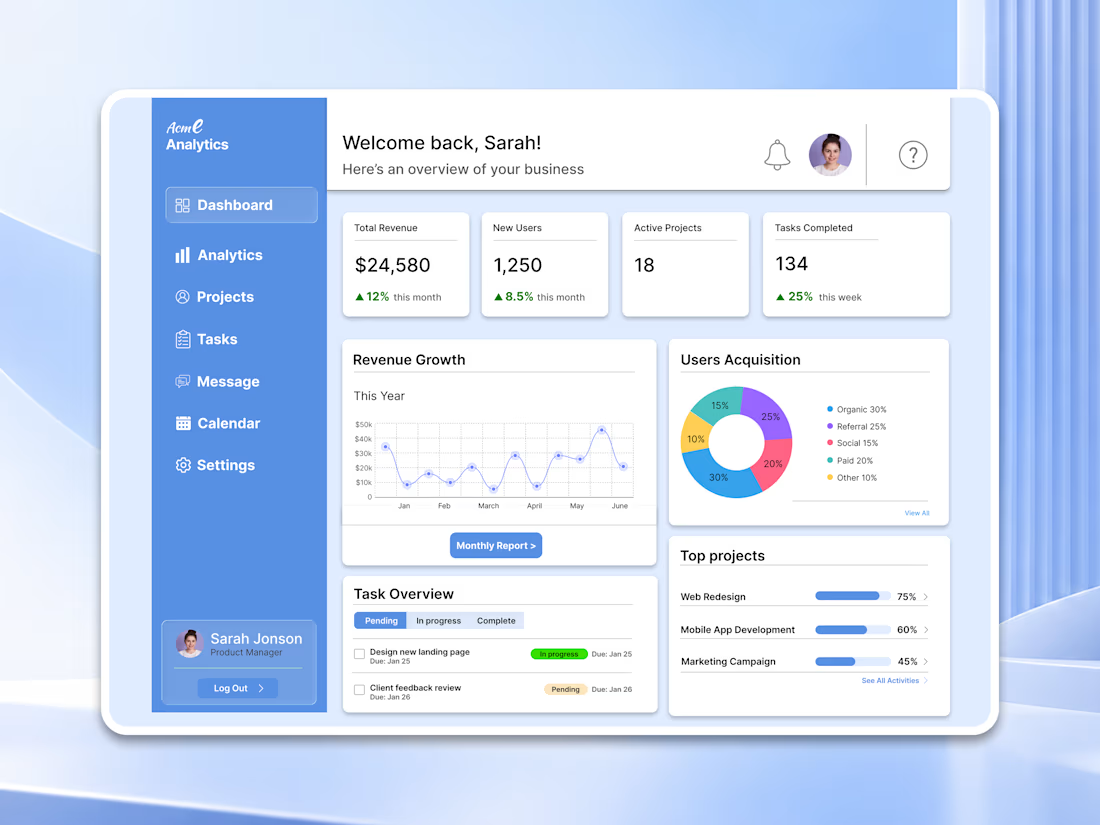
Working on a SaaS dashboard concept in Figma. 🚀
The goal is to make complex business data easier to scan and understand through clear visual hierarchy, structured analytics cards, and organized navigation.
Still refining the details and exploring ways to make the experience more intuitive.
What matters more to you in a dashboard: clean visuals or faster access to insightful?
#Ui designs #Ux design #Saas design #Figma

For a dashboard like this, I’d test whether the key action stays visible when the cards are filled with real, uneven data—not just placeholder numbers. What kind of business data are you designing the first view around?

Building a Modern Restaurant Management Dashboard with Lovable (Light ☀️ vs. Dark 🌙)
I’ve been working on the dashboard interface for ReserveTable (Eat Pro Japan), focusing on giving restaurant managers and users a clean, modern, and intuitive interface to manage bookings, tables, and analytics.
Using Lovable, I was able to rapidly prototype and construct a modern UI system complete with smooth component transitions and native theme switching.
✨ Key Design & Tech Highlights:
⚡ Built with Lovable: Leveraged AI-powered design-to-code workflows to assemble clean component hierarchies, responsive search/filter bars, and sleek cards rapidly.
🌗 Seamless Light & Dark Mode: Designed a flexible color system using modern CSS variables / Tailwind tokens so the entire interface gracefully shifts between an elegant light aesthetic and a moody, dark dining ambience.
🎯 Contextual UI Elements: Styled input controls, select menus, and primary CTA buttons to maintain legibility and contrast across both light and dark themes.


For reservation and table states, the same semantic color tokens need to stay clear in light and dark mode. Did you define status tokens once and map both themes to them, or tune those colors per component?

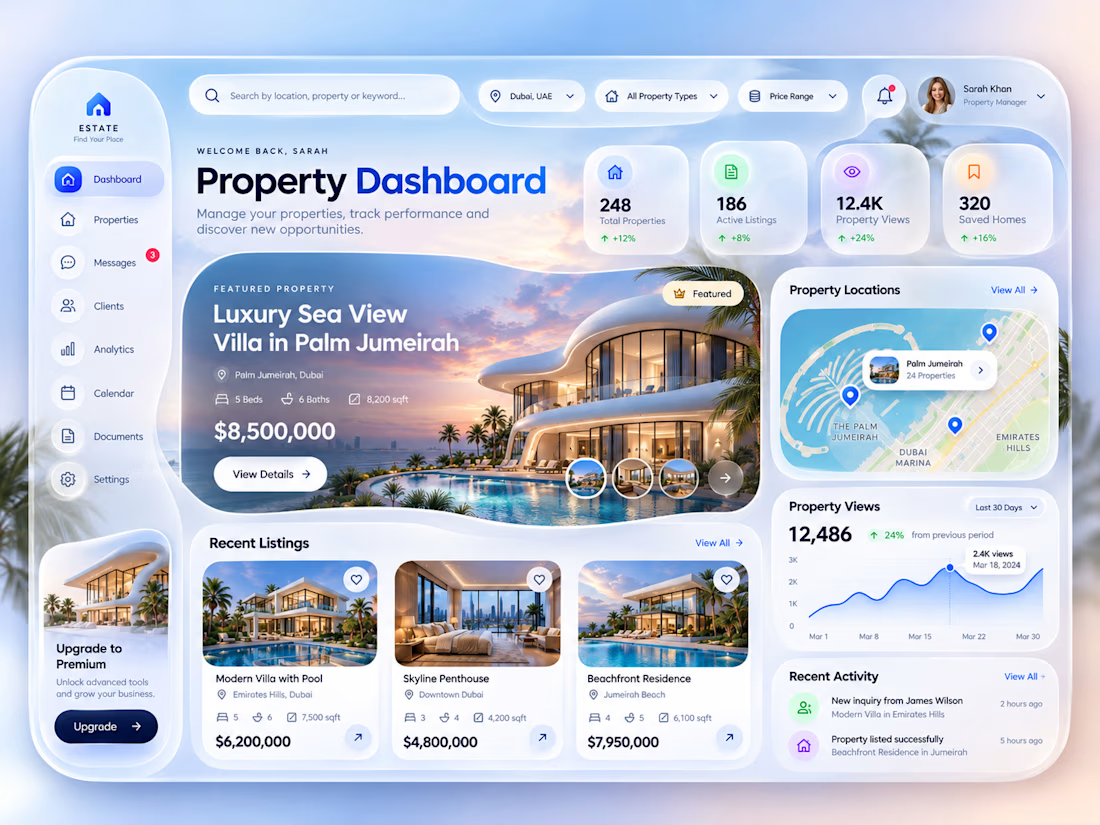
Luxury Real Estate Dashboard, a modern property management dashboard concept designed in Figma.
The idea was to create a premium digital experience that makes managing properties, exploring listings, and tracking performance feel simple and intuitive.
The design combines a soft glassmorphism style, elegant typography, immersive property imagery, and a clean dashboard layout.
Key Features:
Property management dashboard
Luxury property listings
Interactive-style property location map
Property analytics and performance insights
Recent activities and client inquiries
Modern glassmorphism UI
Tool: Figma
Focus: UI/UX Design | Real Estate SaaS | Dashboard Design | Web App Design | Product Design
Have a SaaS platform, dashboard, or digital product in mind?
Open to freelance UI/UX projects and collaborations.



Clean and elegant concept. I like how the analytics and property listings come together in one intuitive dashboard.