The network for creativity
Join 1.25M professional creatives like you
Connect with clients, get discovered, and run your business 100% commission-free
Creatives on Contra have earned over $150M and we are just getting started
Back to feedPost

Most businesses don’t need more reports.
They need reports that update themselves.
A typical reporting process can involve:
→ Exporting data from different systems
→ Cleaning it manually in Excel
→ Copying data between files
→ Updating formulas
→ Creating charts:
→ Sending the final report
This can often be automated.
With Power Query, Power BI, Excel VBA, and Power Automate, I help turn repetitive reporting into a more reliable, automated workflow.
Less manual work.
Fewer errors.
More time for actual analysis.
What’s one report you still update manually every week?

The network for creativity
Join 1.25M professional creatives like you
Connect with clients, get discovered, and run your business 100% commission-free
Creatives on Contra have earned over $150M and we are just getting started




Related posts

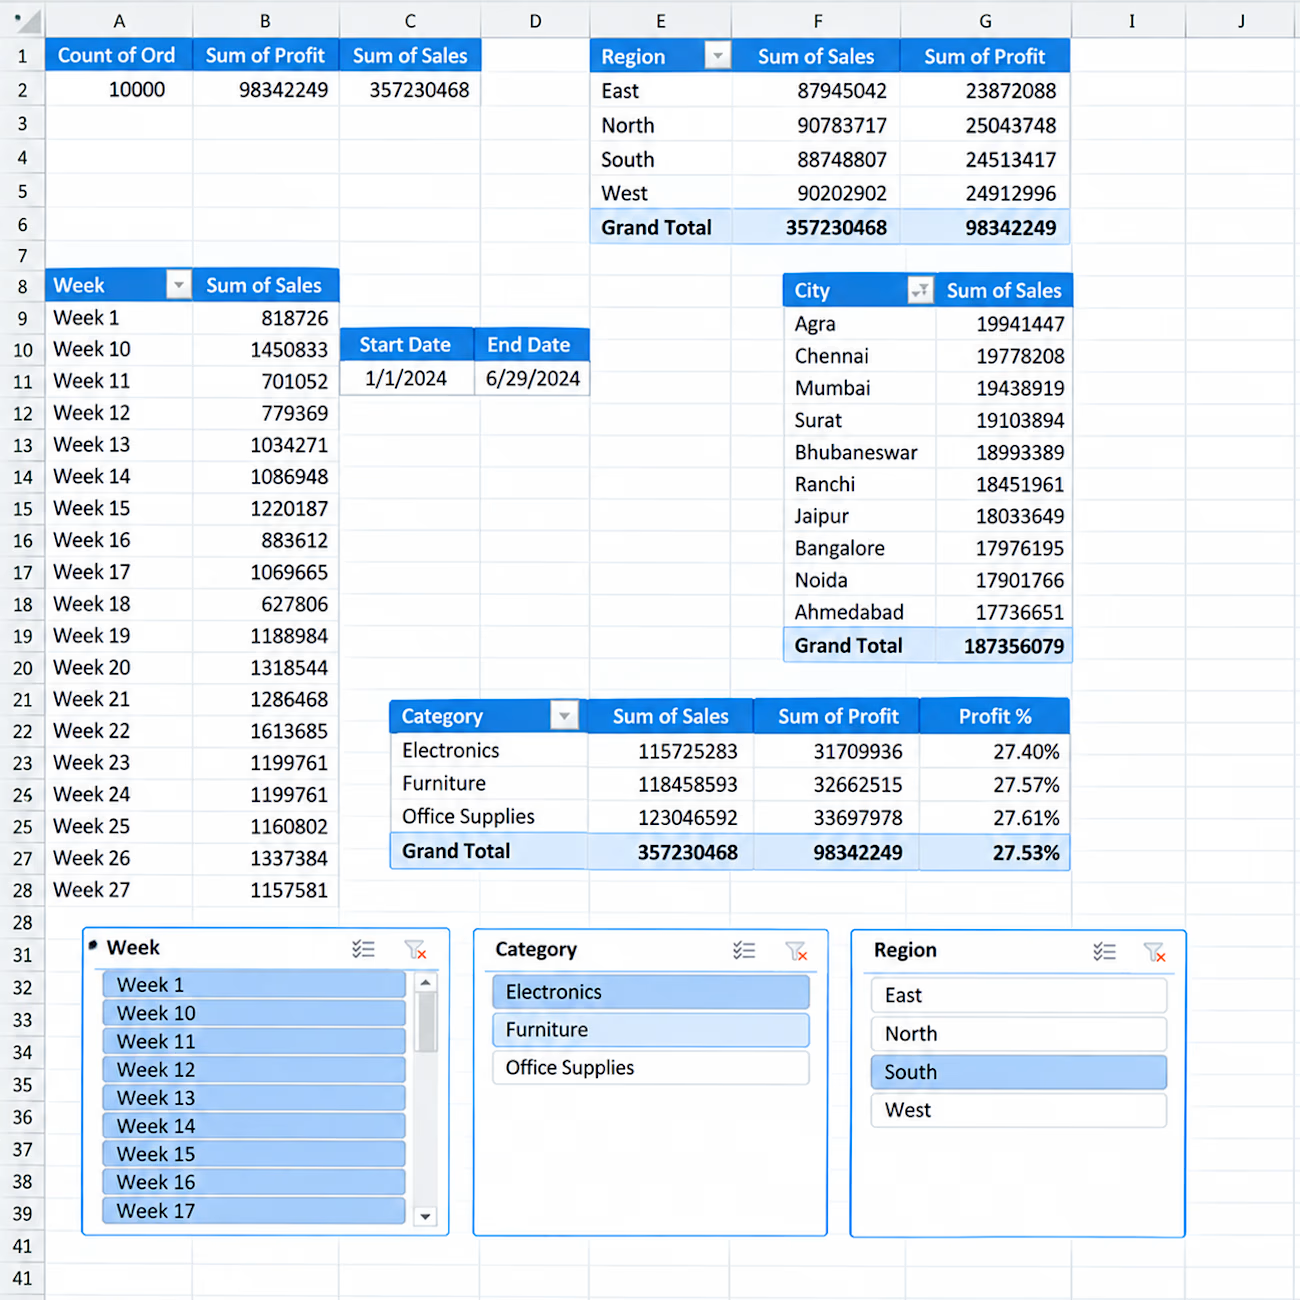
📊 Interactive Sales Analytics Dashboard in Excel
I created an interactive Excel dashboard to analyze sales performance across different business dimensions.
Key Insights & Features:
• Total Orders, Sales & Profit KPIs
• Sales & Profit by Region
• Sales by City
• Category-wise Sales, Profit & Profit %
• Weekly Sales Analysis
• Interactive Slicers for Week, Category & Region
• Start Date & End Date tracking
• PivotTable-based analysis
This dashboard is designed to turn raw sales data into clear and actionable business insights using Excel.


Hello.
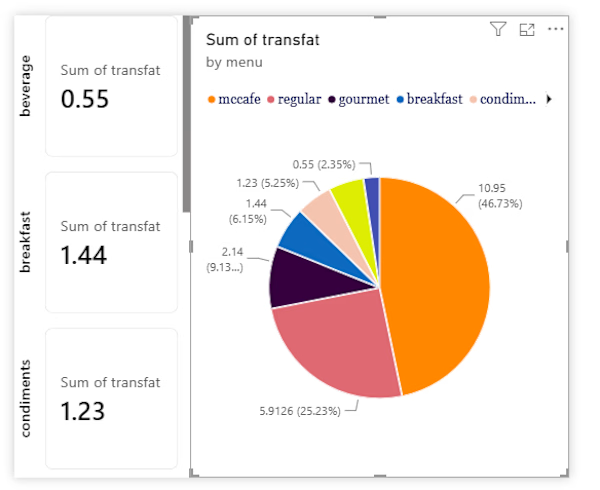
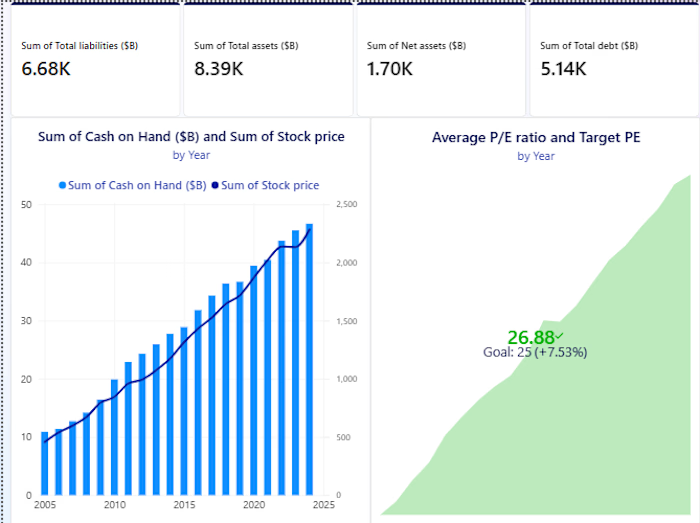
I guess we're in the same page about data analysis and visualization


If you’re building SaaS products, read this.
SaaS products need to prove they’re worth attention in 3-5 seconds.
And in that time span, you need to say what it does, who it is for, and the benefits.
Or your customer will leave.
Your product should clearly demonstrate its process.
Clarify the pricing section.
Prove its capabilities with testimonials.
And guide them to the next action.
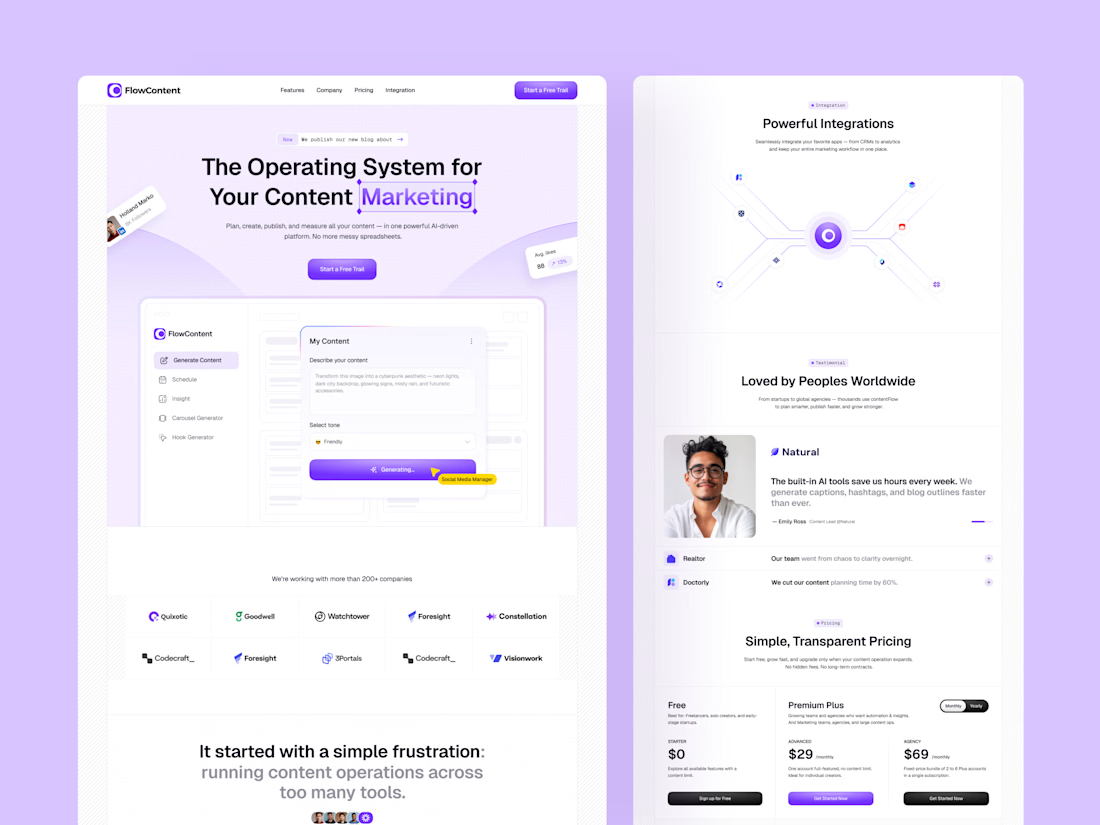
FlowContent template is built for that decision moment.
With feature sections, AI capability highlights, workflow demonstrations, integration, and clear pricing.
Perfect for content marketing automation tools, AI-powered publishing platforms, and content management startups.
It covers the full SaaS buyer journey from searching to awareness to clicking the CTA.
What do you search for in a SaaS product?


AI Data Assistant Inside Power BI
I built an AI-powered chatbot directly inside Power BI to help users interact with their existing dashboards and data through natural-language questions.
Instead of manually opening multiple dashboards to find a specific metric, users can ask the assistant a business question and receive a data-grounded answer along with the relevant report/dashboard source.
The assistant works across multiple Power BI dashboards and can provide context from the available reports, making it easier to find insights without changing the existing BI environment.
Key capabilities:
- Ask questions directly inside Power BI
- Connect with existing Power BI data
- Search across dashboards and reports
- Get relevant metrics and insights
- Identify the source report/dashboard
- Answer data-driven business questions
- Work within existing BI infrastructure
- Add a conversational layer to Power BI

