The network for creativity
Join 1.25M professional creatives like you
Connect with clients, get discovered, and run your business 100% commission-free
Creatives on Contra have earned over $150M and we are just getting started
Back to feedPost

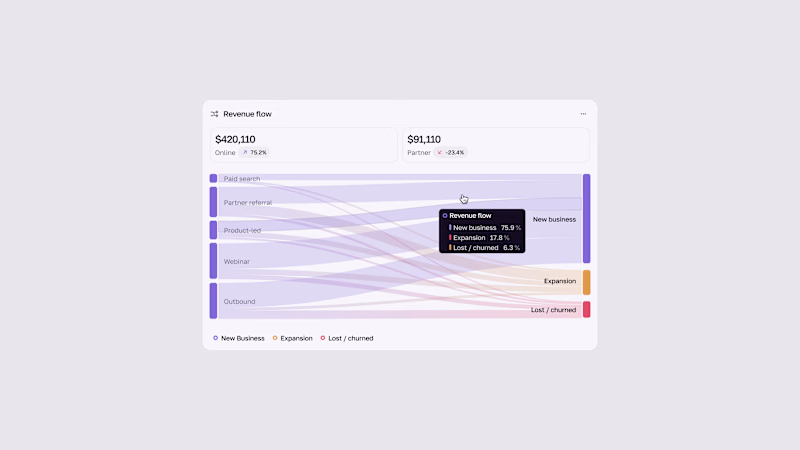
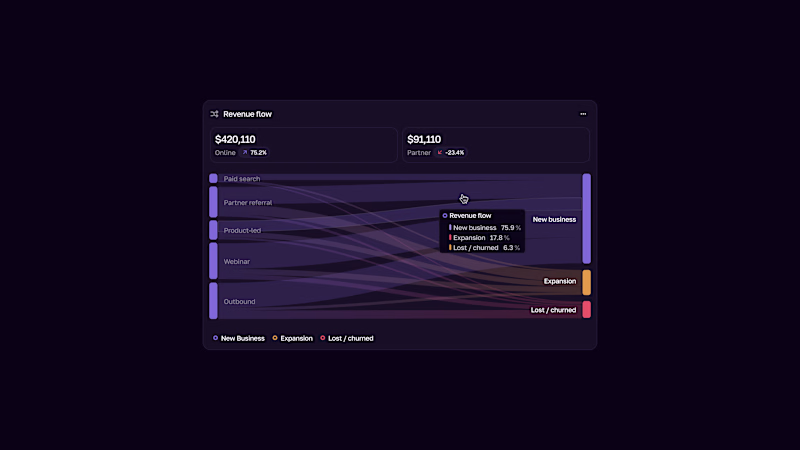
Smart Home UI Redesign
Transforming a standard dashboard into a premium experience.
• Style: Dark Mode & Glassmorphism.
• UX: Enhanced readability and visual hierarchy.
• Tools: Figma.


The network for creativity
Join 1.25M professional creatives like you
Connect with clients, get discovered, and run your business 100% commission-free
Creatives on Contra have earned over $150M and we are just getting started
Related posts



Brand Expressions -- Merdes



love this

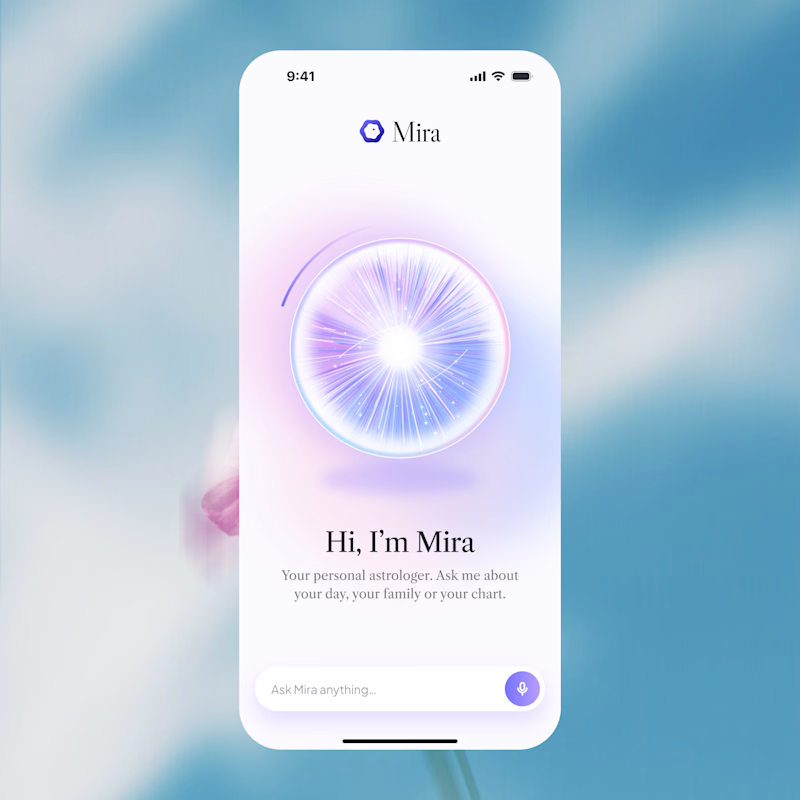
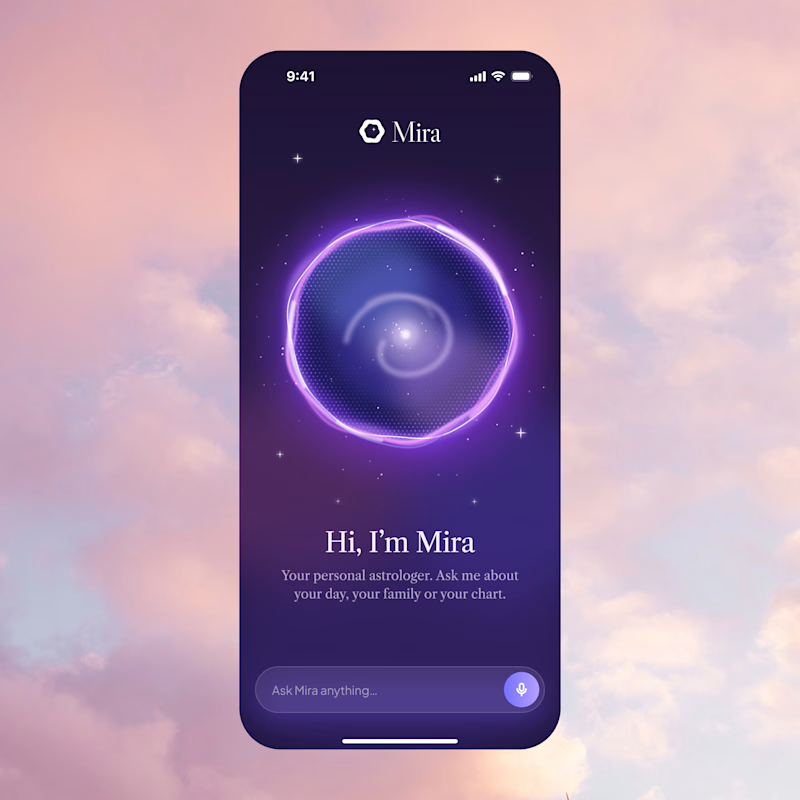
Two directions for Mira, an AI astrologer you talk to by voice.
Only one made it past the client. Which one would you ship, and why?
12 voted
75%
4 voted
25%
16 votes
Closed

A is better if you can make a dark version of it thats incredible