The network for creativity
Join 1.25M professional creatives like you
Connect with clients, get discovered, and run your business 100% commission-free
Creatives on Contra have earned over $150M and we are just getting started
Back to feedPost

Electric vehicle data is only useful if you can actually find it in one place. This project started with exactly that problem: the data was scattered, and nobody could get a clear picture of what was on the road.
I tracked the data down and pulled it together using SQL. I cleaned it up by removing duplicates, fixing inconsistent entries, and dealing with missing values. Then I built an interactive dashboard in Power BI on top of it.
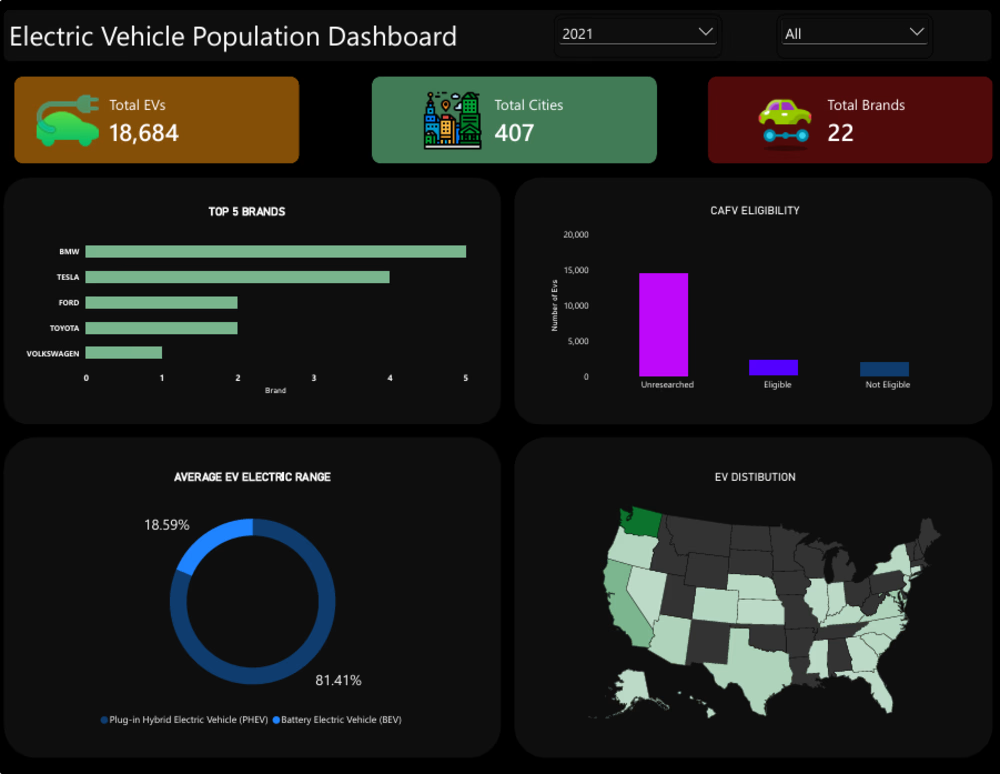
The dashboard shows:
• Total EVs, cities and brands at a glance
• Which brands lead the market
• How many vehicles qualify for clean fuel incentives, and how many have never been checked
• The split between fully electric and plug-in hybrid vehicles
• Where EVs are concentrated across the US map
You can filter by year and brand to explore the numbers yourself.
Tools: SQL, Power BI
The network for creativity
Join 1.25M professional creatives like you
Connect with clients, get discovered, and run your business 100% commission-free
Creatives on Contra have earned over $150M and we are just getting started



Related posts





Solar data is usually charts and kW. Elysia turns it into your house, so you can tell at a glance what the roof is doing.
Branding, UI/UX, 3D and motion.



Full of visual hierarchy