The network for creativity
Join 1.25M professional creatives like you
Connect with clients, get discovered, and run your business 100% commission-free
Creatives on Contra have earned over $150M and we are just getting started
Back to feedPost
Holiday Budget & Gift Planner (Excel, Google Sheets & Printable)


The network for creativity
Join 1.25M professional creatives like you
Connect with clients, get discovered, and run your business 100% commission-free
Creatives on Contra have earned over $150M and we are just getting started
Related posts

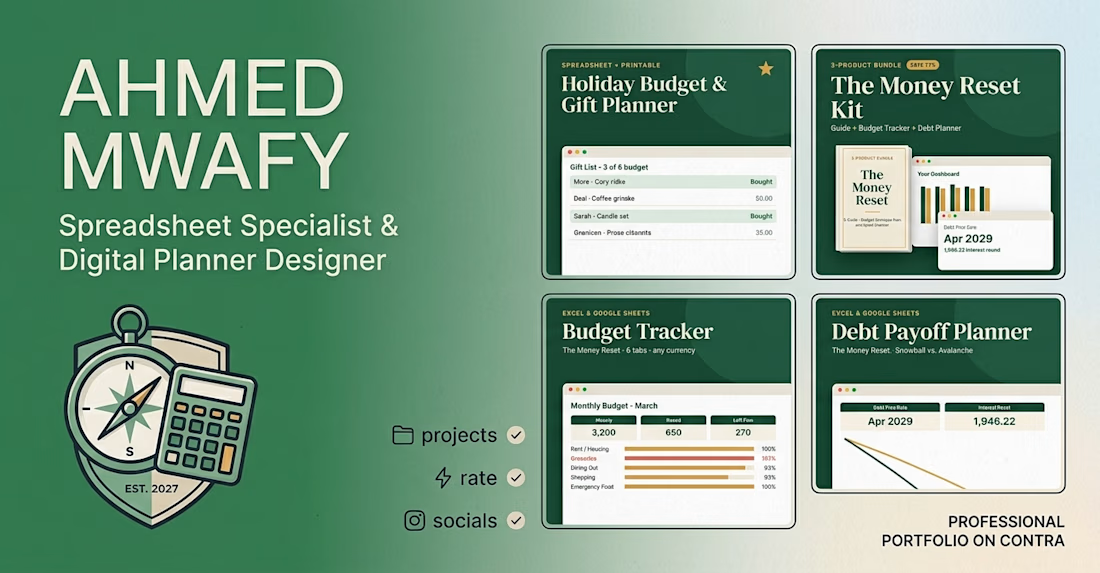
"Welcome to my specialized portfolio! I craft intuitive Google Sheets tools and digital planners to simplify your financial tracking and productivity."

This interactive dashboard provides a comprehensive view of profit performance across multiple dimensions—time, segments, regions, categories, and sub‑categories.
This dashboard transforms raw business data into actionable insights by allowing stakeholders to quickly identify profitable areas, spot regional trends, and evaluate category performance. It’s designed for clarity, interactivity, and decision‑making support.

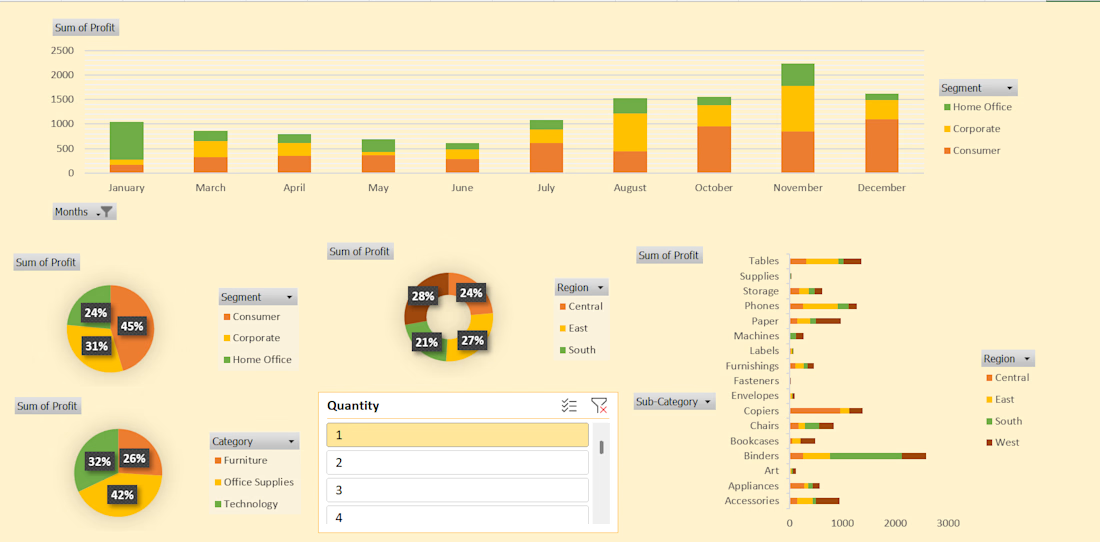
#This is an excellent Profit Dashboard which is made in MS Excel with multiple creative functions help in understanding Monthly , Yearly , Area wise Profits.
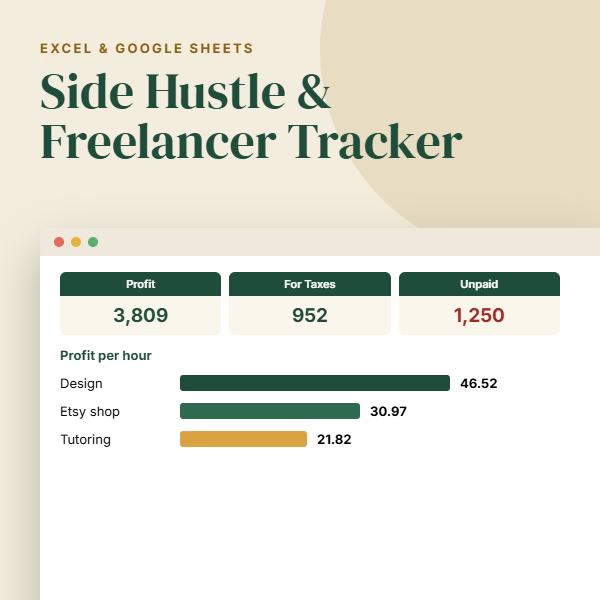
The Side Hustle & Freelancer Money Tracker (.xlsx)
Works with Microsoft Excel and Google Sheets (free)
Works with any currency and any country
Example data included so you see how everything works
Reuse it every year