The network for creativity
Join 1.25M professional creatives like you
Connect with clients, get discovered, and run your business 100% commission-free
Creatives on Contra have earned over $150M and we are just getting started
Back to feedPost

Hi Guys 🖐,
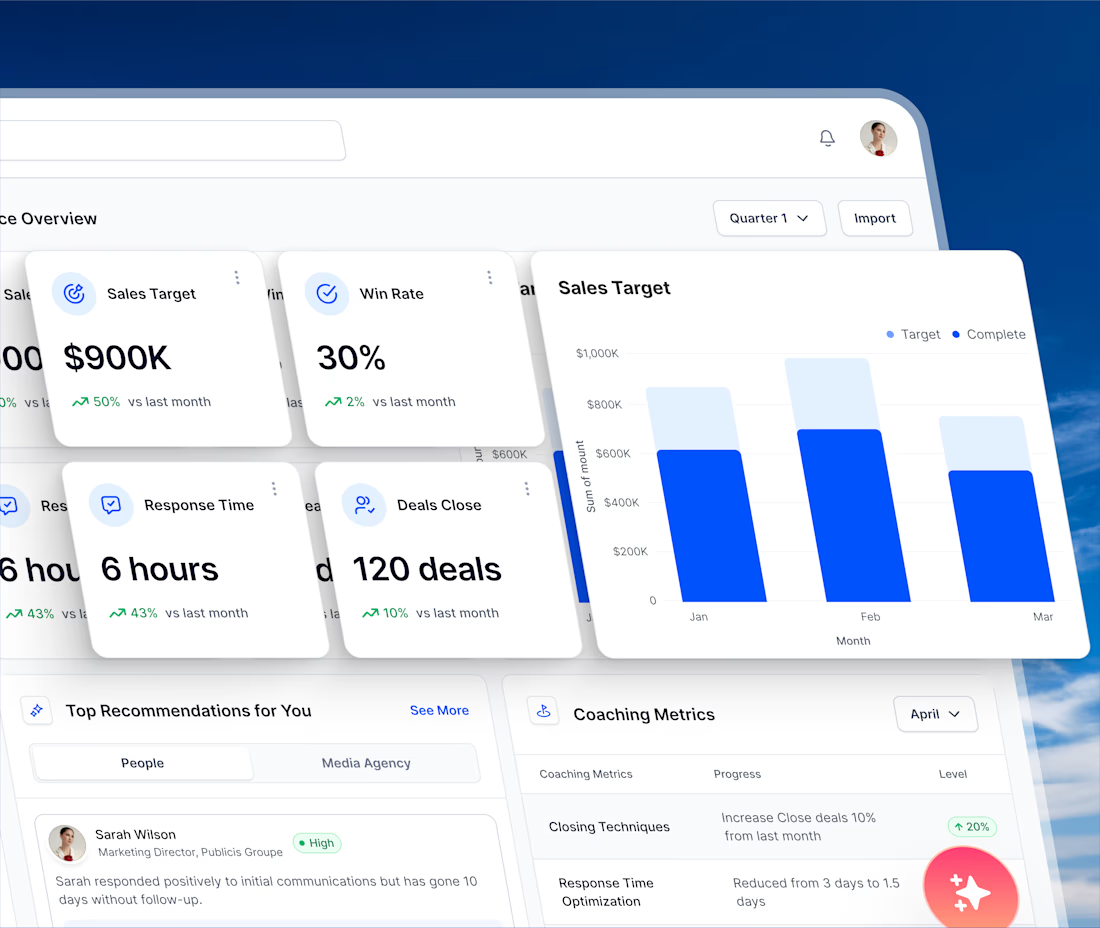
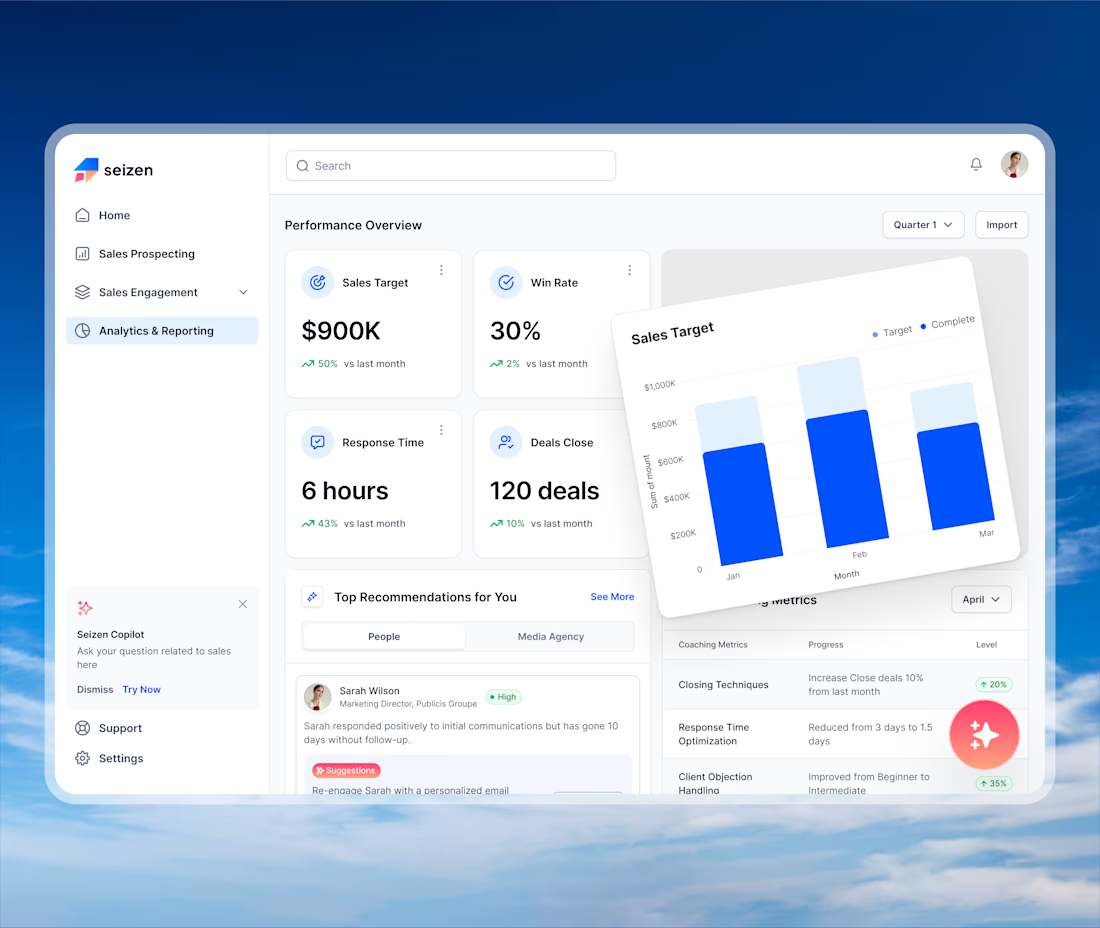
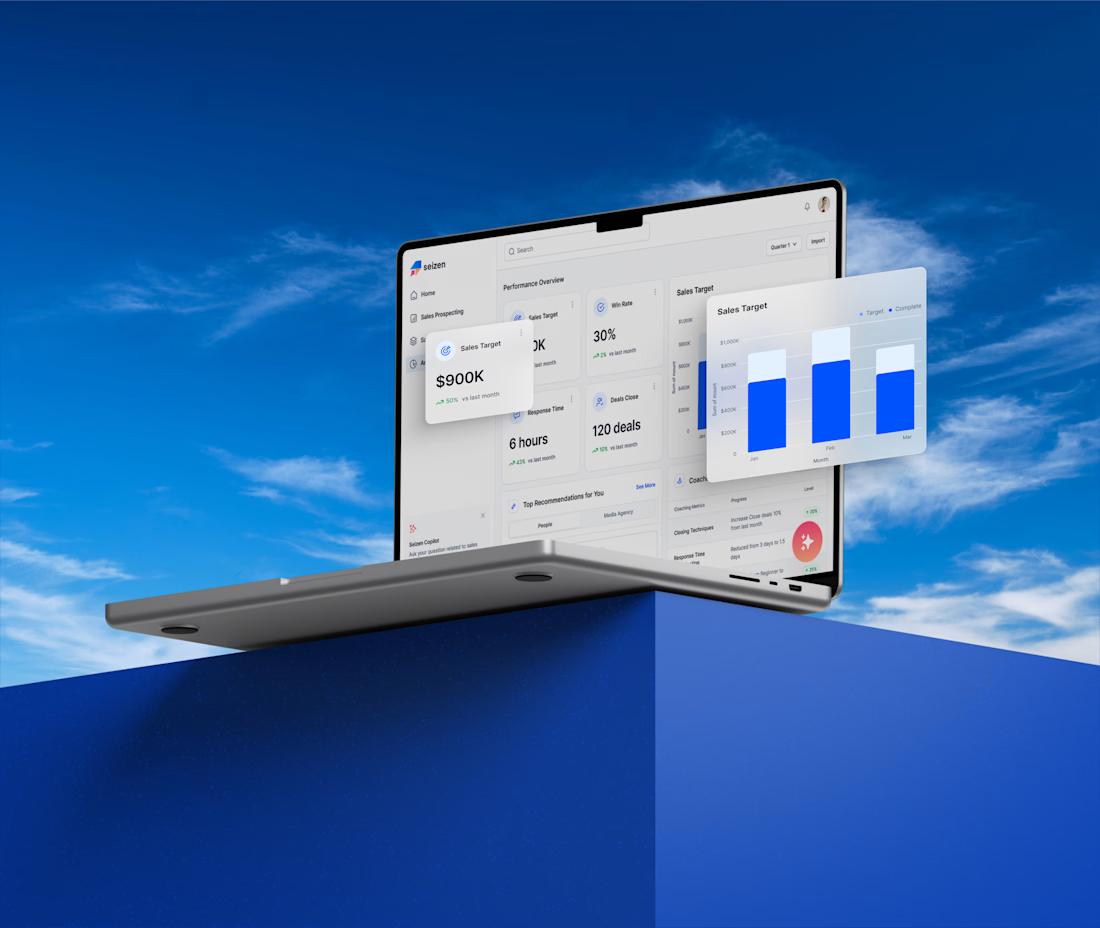
Meet Seizen, a data-driven sales analytics dashboard designed to help sales teams monitor performance and make informed decisions.
The dashboard brings key sales insights into one place, from revenue performance and sales trends to customer data and conversion metrics. With a clean and intuitive interface, Seizen makes complex sales data easier to understand and act on.
What are your thoughts on this sales analytics dashboard? We'd love to hear your feedback!

The network for creativity
Join 1.25M professional creatives like you
Connect with clients, get discovered, and run your business 100% commission-free
Creatives on Contra have earned over $150M and we are just getting started


Related posts

Your dashboard shouldn't need a dashboard to explain it. 👀
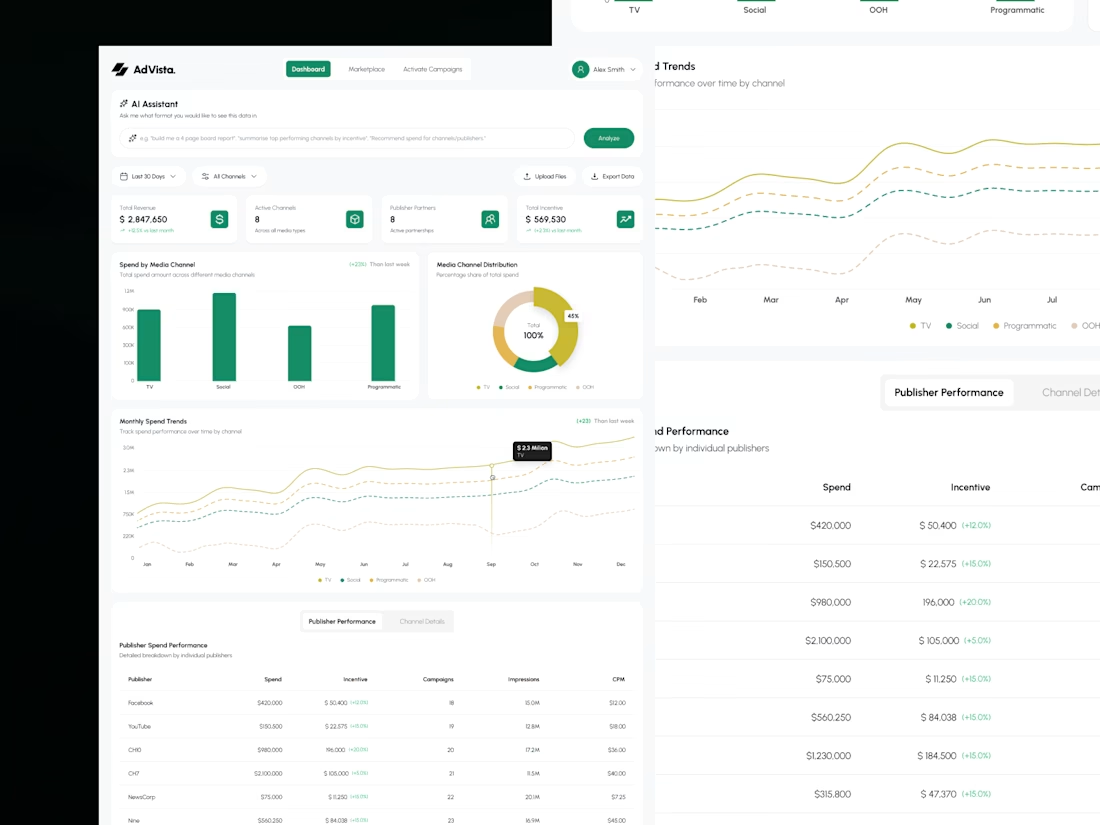
Meet AdVisa, an affiliate analytics concept built around clarity, clean charts, and smarter data exploration.
Here's the design breakdown. 🧵
#DashboardDesign #SaaSDesign #UIUX #DataVisualization
(1/5)
Less noise. More insights. 📊
I organized revenue, spending trends, and campaign metrics into a clean dashboard that makes important numbers easier to scan.
Because the best analytics experience helps you find answers, not just data.
(2/5)

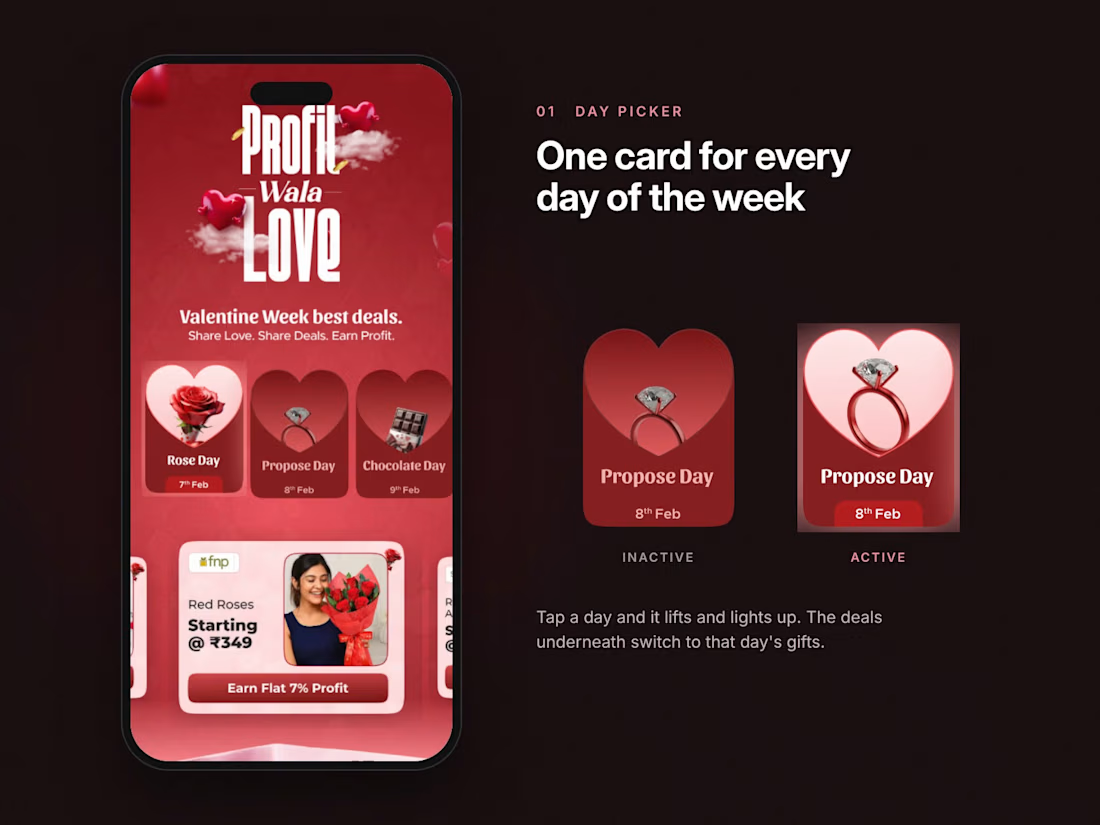
One week, one landing page, ₹9.89 lakh in sales and 13,707 shares.
For CashKaro's Valentine Week campaign I gave every day of the week its own card. Rose Day, Propose Day, Chocolate Day. Tap a day and the deals underneath switch to that day's gifts.
Every deal card shows three things. The retailer, the price and the profit you earn by sharing it. Nothing else. People share what they understand at a glance.
What makes you share a deal with someone?

Built a trading dashboard for Kleos Elite Club.

Brilliant!