The network for creativity
Join 1.25M professional creatives like you
Connect with clients, get discovered, and run your business 100% commission-free
Creatives on Contra have earned over $150M and we are just getting started
Back to feedPost

Your dashboard shouldn't need a dashboard to explain it. 👀
Meet AdVisa, an affiliate analytics concept built around clarity, clean charts, and smarter data exploration.
Here's the design breakdown. 🧵
#DashboardDesign #SaaSDesign #UIUX #DataVisualization
(1/5)
Less noise. More insights. 📊
I organized revenue, spending trends, and campaign metrics into a clean dashboard that makes important numbers easier to scan.
Because the best analytics experience helps you find answers, not just data.
(2/5)
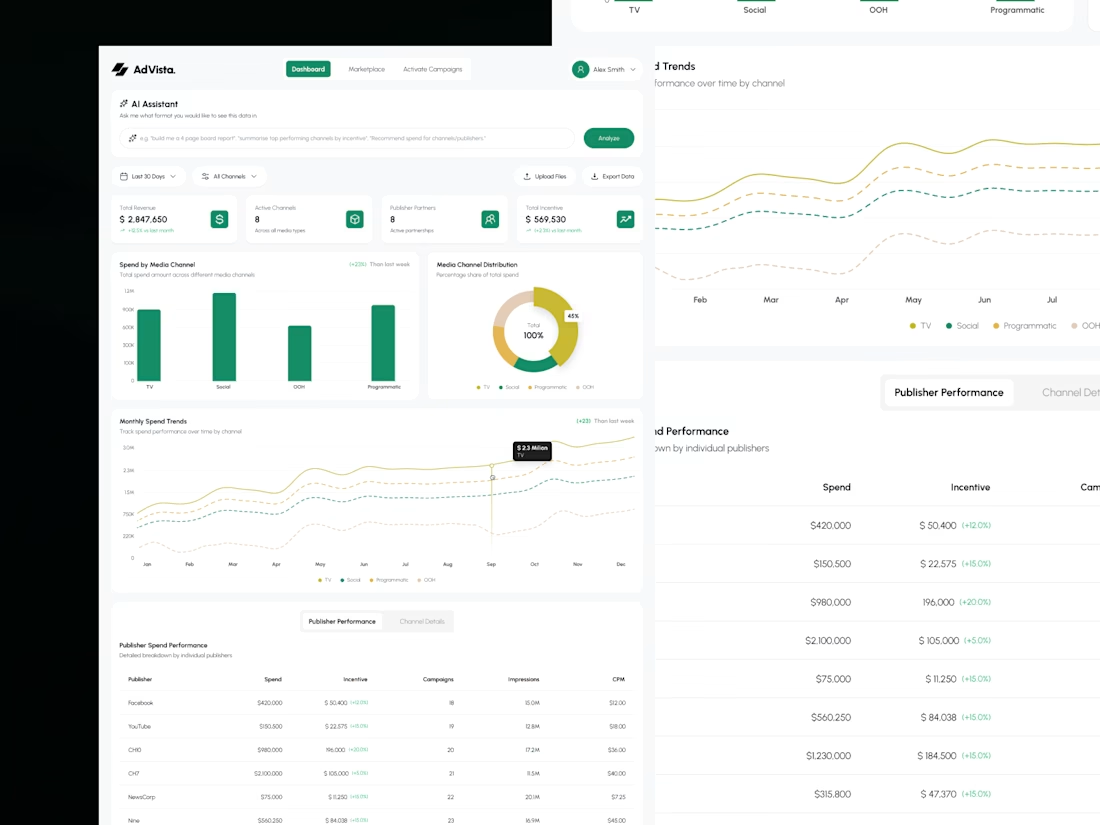
Complex analytics, simplified. 💻
From performance charts to publisher metrics, every section follows a clear visual hierarchy.
The goal? Help users understand what's happening without digging through endless tables.
(3/5)
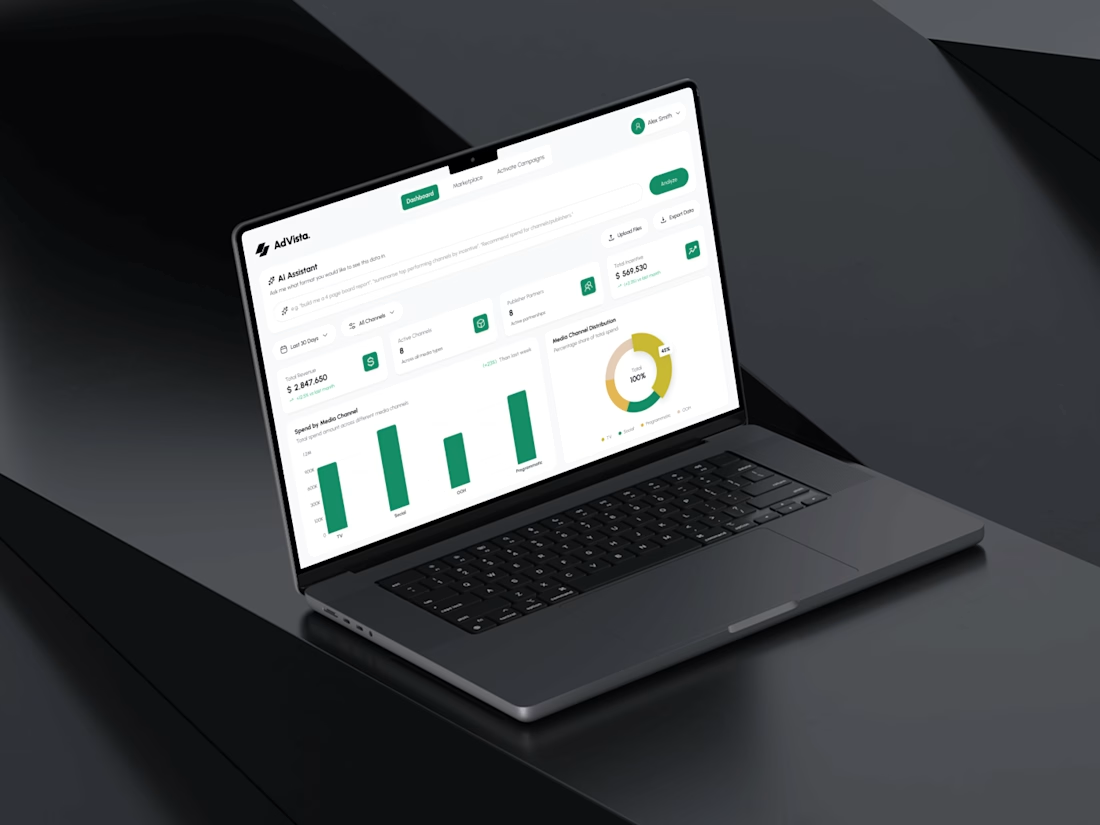
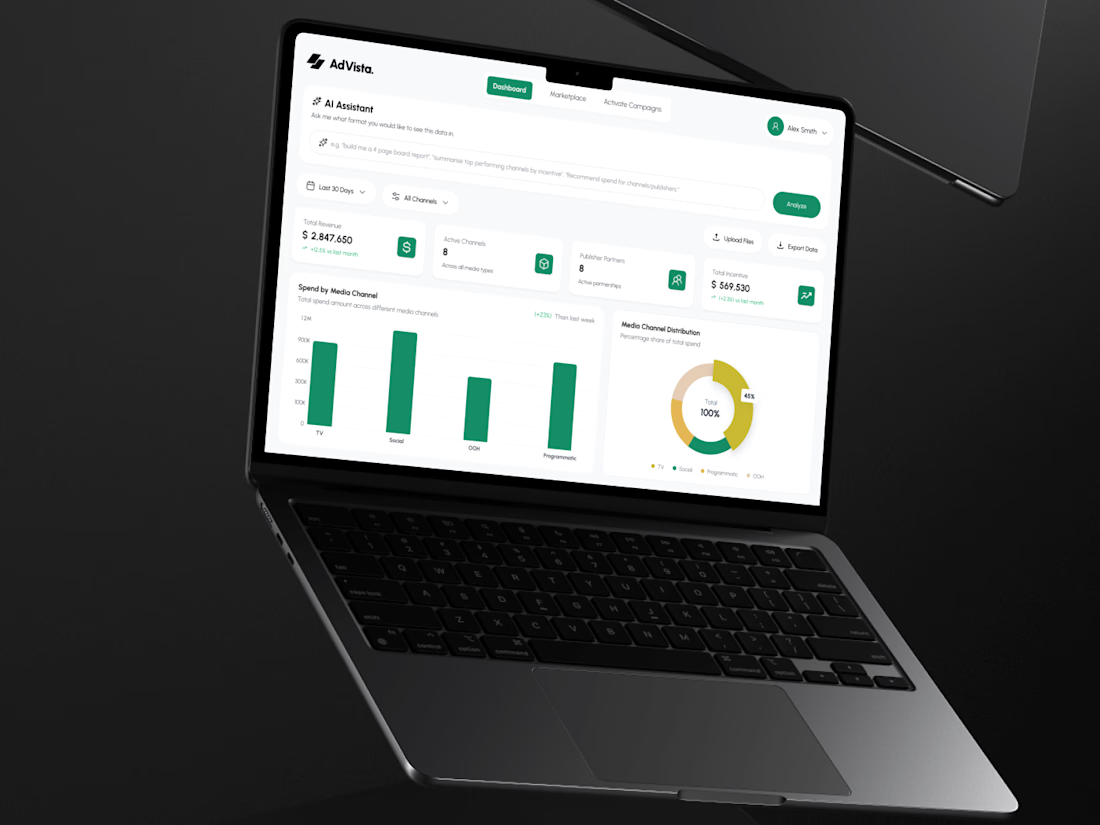
A good dashboard needs more than good charts. 🎨
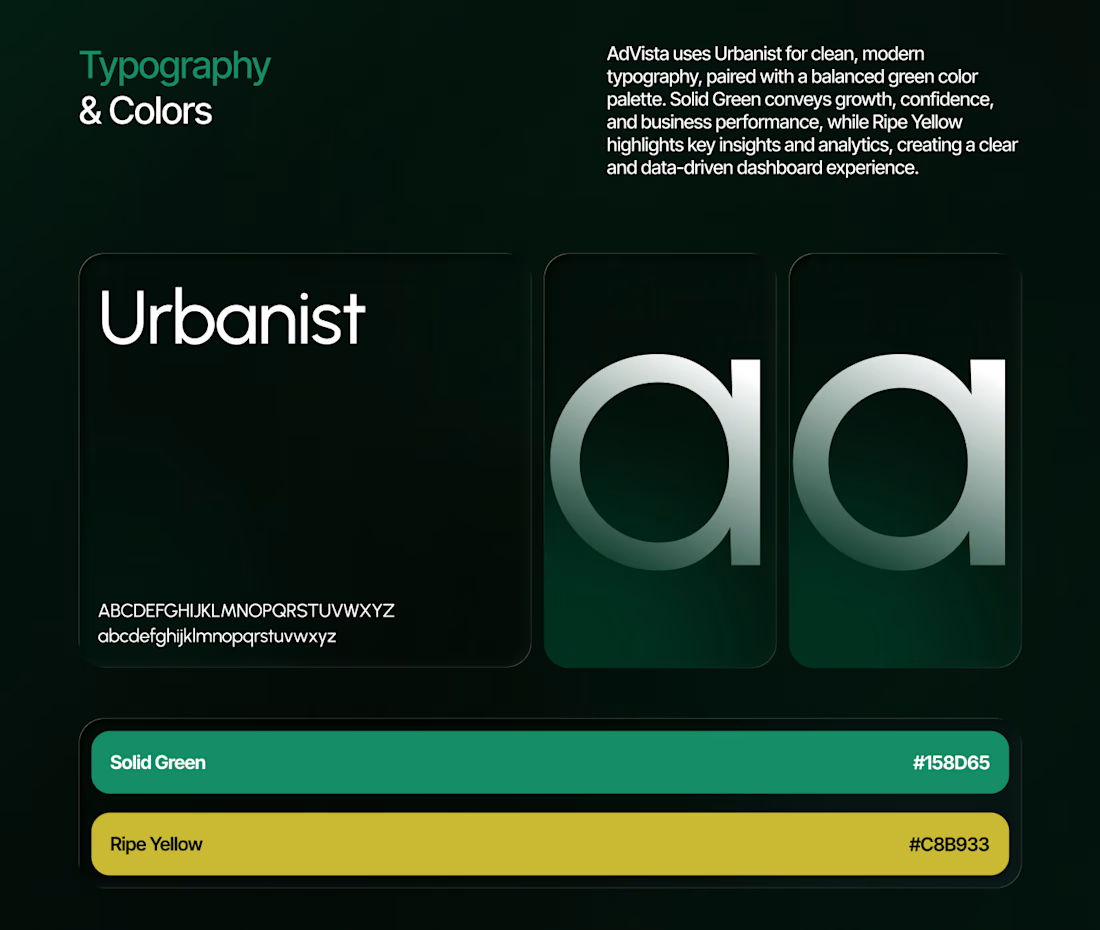
For AdVisa, I paired Urbanist typography with refined green accents, structured spacing, and consistent UI components.
Clean, functional, and built for data-heavy workflows.
(4/5)
And that's AdVisa! 🚀
What's the first thing you look for in an analytics dashboard?
More designs:
https://www.behance.net/gallery/255686253/AdVista-AI-Analytics-Ad-Campaign-Dashboard
Building a SaaS product or dashboard? DMs are open.
(5/5)
The network for creativity
Join 1.25M professional creatives like you
Connect with clients, get discovered, and run your business 100% commission-free
Creatives on Contra have earned over $150M and we are just getting started


Related posts

Dashboard design for AllWays Holiday.
Clarity is what makes a good dashboard.
Every section, metric and action should help users understand what's happening and what needs their attention.
Designed to make managing travel operations easier.

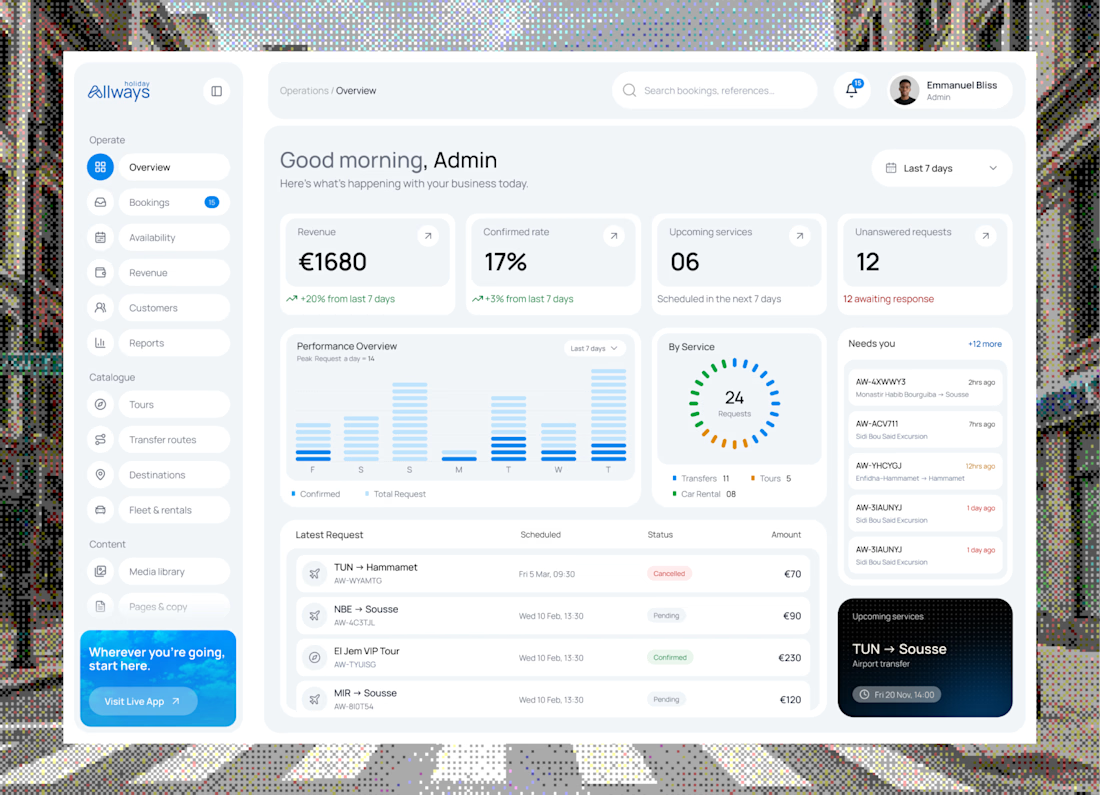

"What needs their attention" is the part most dashboards miss. Clean KPI cards up top, then the list below makes it easy to act. Did you consider pulling urgent bookings or issues into their own highlighted block, so ops teams see problems before they scroll?

New case study!!
Fintech SaaS Dashboard, Web & Mobile App UX/UI ⚡
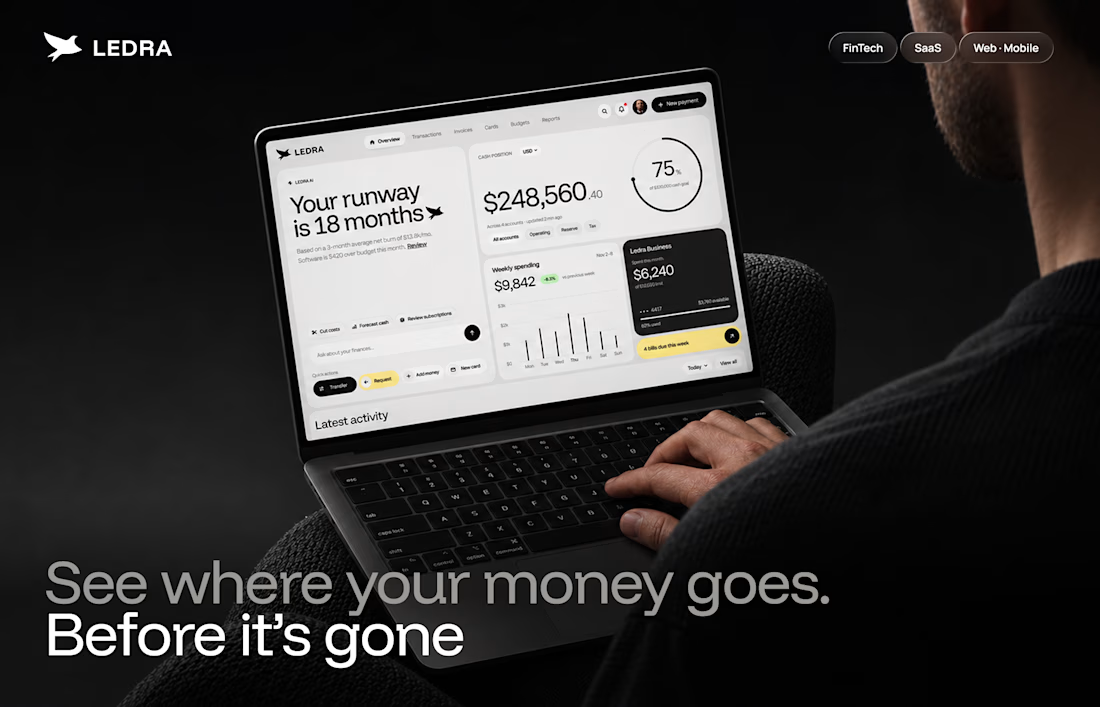
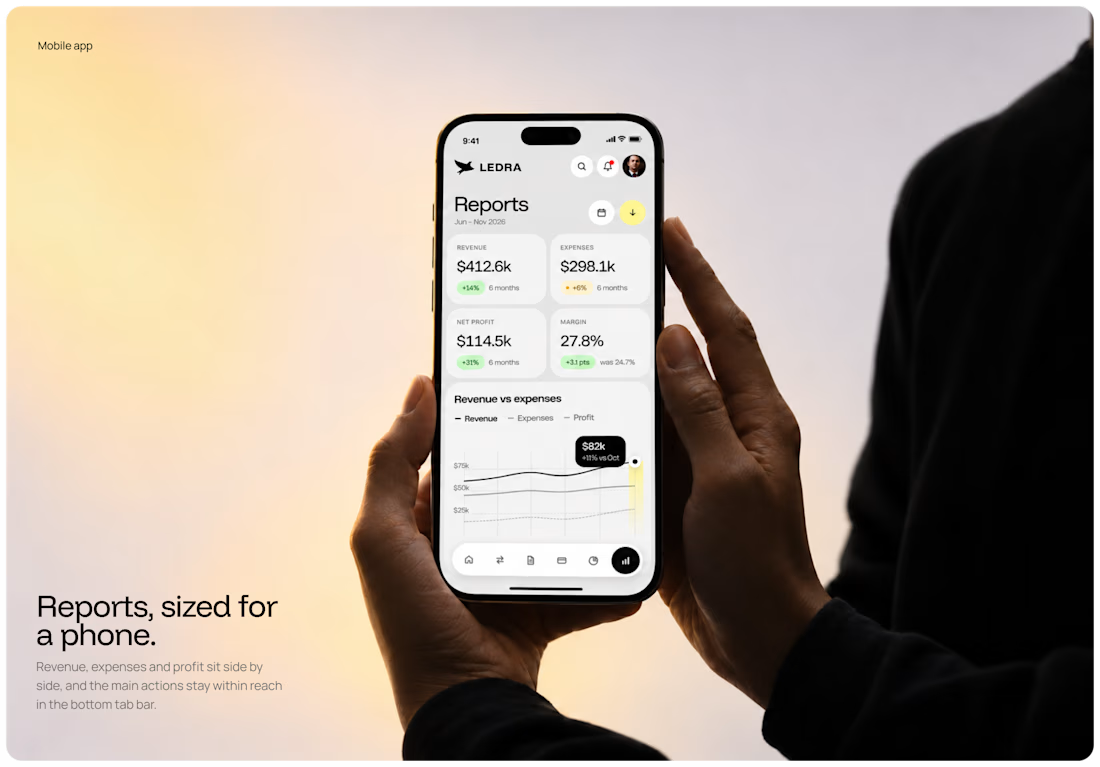

Most AI dashboards show you charts. Few tell you what needs your yes.
Ledgerline puts weekly spend and the approval queue on one screen, so the bill and the risky actions never surprise you.
Queue beside the chart, or full screen when something is waiting?


Putting the approval queue right next to the chart is a smart call, the risky stuff doesn't get buried. I'd go side by side and only flip to full screen when something is actually blocked.