The network for creativity
Join 1.25M professional creatives like you
Connect with clients, get discovered, and run your business 100% commission-free
Creatives on Contra have earned over $150M and we are just getting started
Back to feedPost

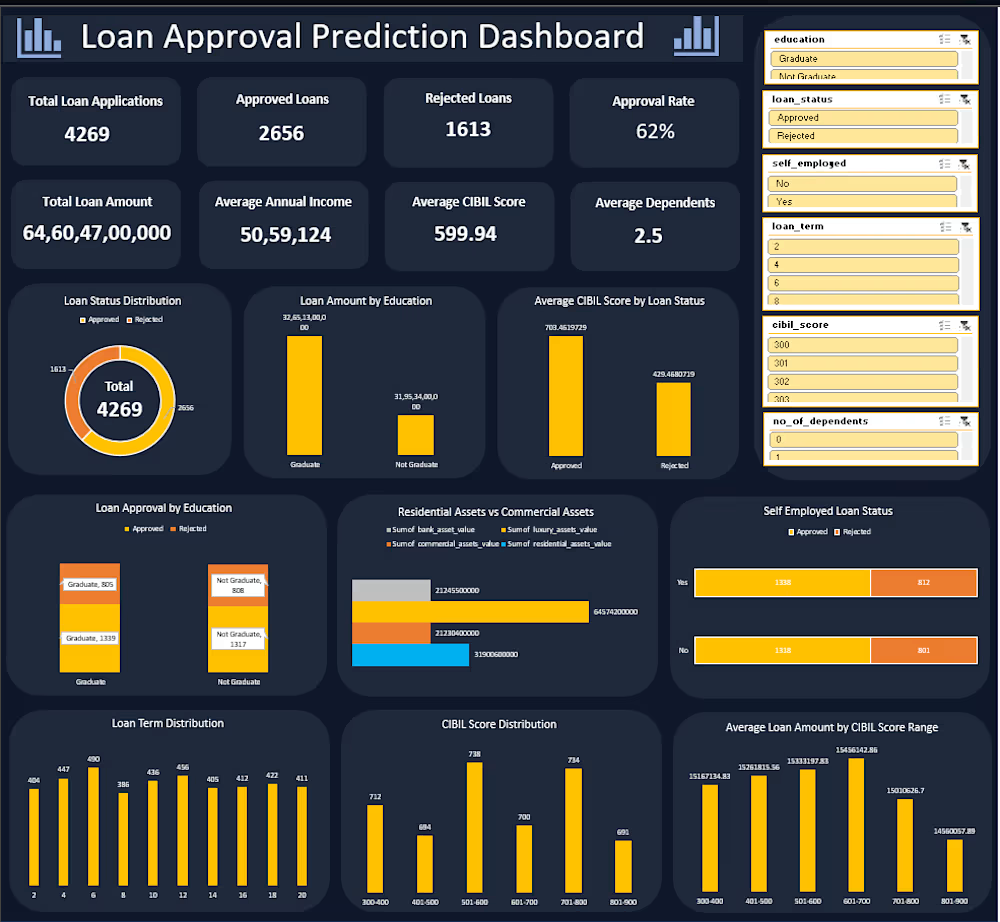
Warehouse data is often trapped across messy spreadsheets, making it difficult to see capacity problems before backlog grows.
I built this Excel operations dashboard to turn order-level data into a clear management view of:
• Orders, units and weight
• Productivity by workstream
• Demand versus available capacity
• Daily backlog movement
• Operational exceptions and trends
The calculations, assumptions and charts are fully editable—not a static mock-up.
If your spreadsheet reporting takes hours each week or doesn’t give you a clear operational picture, send me a message. I can help turn it into a practical business tool.

The network for creativity
Join 1.25M professional creatives like you
Connect with clients, get discovered, and run your business 100% commission-free
Creatives on Contra have earned over $150M and we are just getting started
Trending
retrofuturism
Share your favorite designs from the past exploring the distant future. Or your own take on the aesthetic 🚀
halftone
Dots. Texture. Grain. Let's see your designs using the halftone technique.

Midjourney
Creatives are showing off what they're making with Midjourney.
colorgrade
Video editors sound off: How do you enhance the mood of your video in color grading?


Related posts

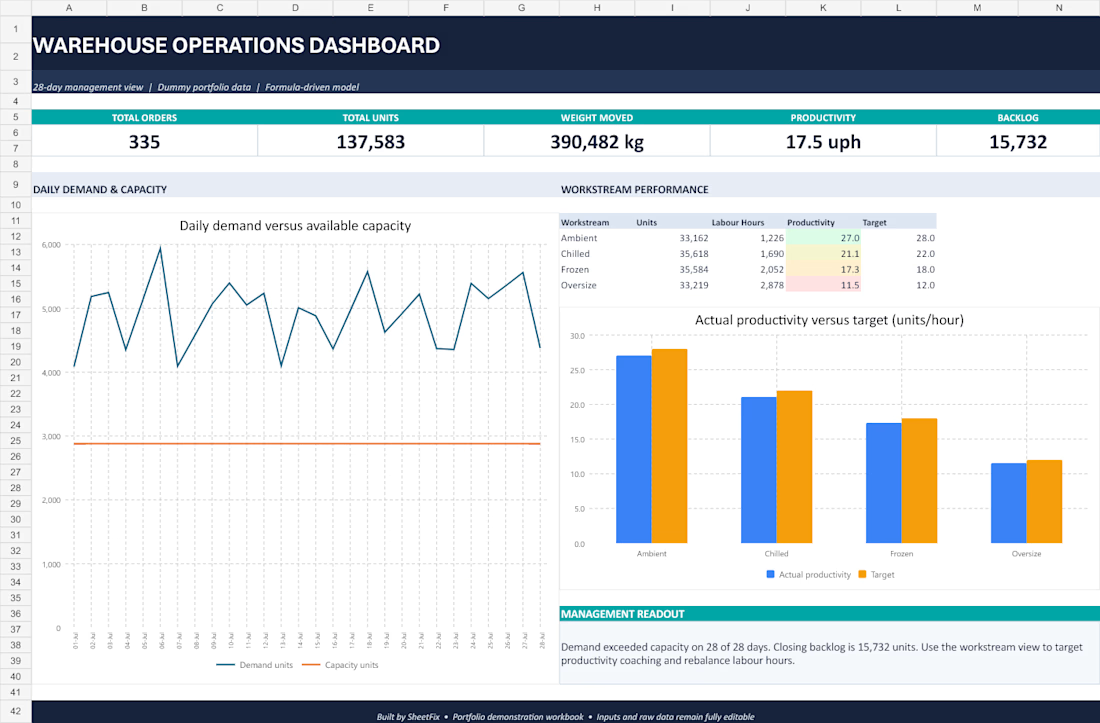
This portfolio sample shows how I evaluate AI agents and automated workflows to find reliability problems, broken logic, and weak edge-case handling. I review whether the system completes the intended task, uses tools correctly, follows instructions, handles ambiguity, and produces an output that can actually be trusted.
The work focuses on identifying failure points before they become real user problems, including incomplete task execution, incorrect assumptions, workflow dead ends, hallucinations, and verification gaps. This is a portfolio demonstration of my AI agent evaluation and red-teaming work. No confidential client information is included.



Thorough breakdown! Robust edge-case handling and reliability checks are definitely the trickiest part of building reliable AI agents 🤖📊

Sales & Expense Data Entry
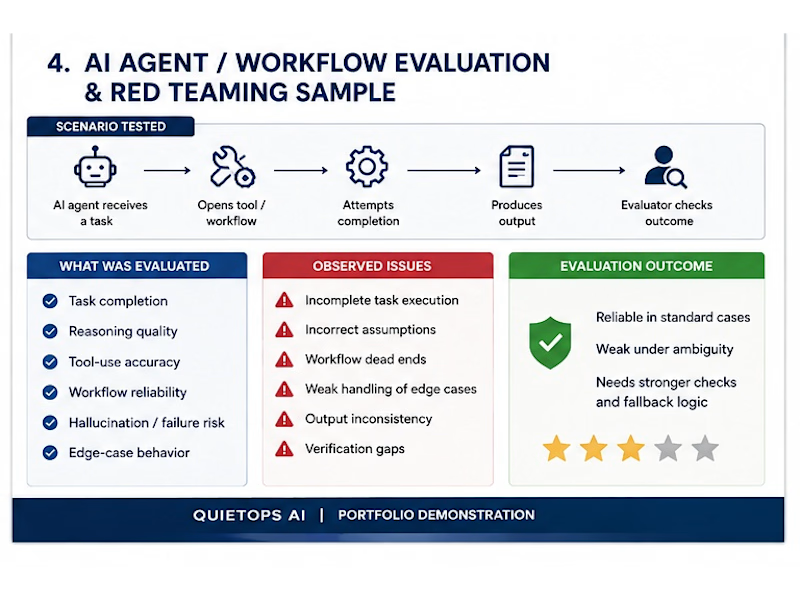
Created and organized a structured sales and expense spreadsheet in Microsoft Excel. Entered customer records, dates, categories, amounts, payment status, and notes, then formatted the data into a clear and easy-to-read table.
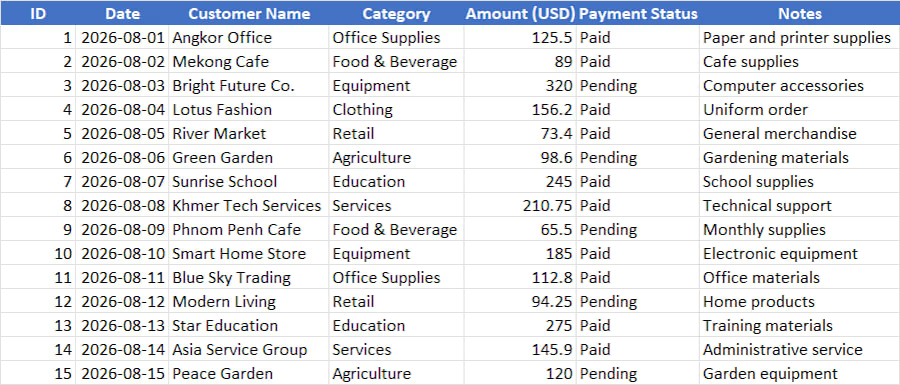

This is a banking credit dashboard I built from scratch to turn messy loan application records into clear, actionable visuals. The main goal was to analyze what factors actually cause a loan to get approved or rejected.
Here is how I worked on this project manually:
Data Formatting: I cleaned and sorted the raw dataset in Excel, fixing missing rows and organizing the numbers for a flawless setup.
KPI Calculation: I calculated core credit metrics, such as total loan amounts, average annual income, average CIBIL scores (599.9), and the final approval percentage (62%).
Insightful Charts: I created custom visuals to show important comparisons, like loan approval rates based on education levels and a breakdown of residential vs commercial assets.
I designed this entire dashboard on a dark background to make the charts stand out and look clean. Anyone can click the filters on the side to update the whole screen instantly.
Tools used: Advanced Excel (Pivot Tables, Slicers, Data Visualization, Data Analysis)