The network for creativity
Join 1.25M professional creatives like you
Connect with clients, get discovered, and run your business 100% commission-free
Creatives on Contra have earned over $150M and we are just getting started
Back to feedPost
HR Workforce Analytics Dashboard
An end-to-end HR analytics project built in Power BI to help management understand workforce distribution, salary patterns, leave behavior, overtime load, and employee growth across countries and departments.
Executive Summary
This project turns a flat employee dataset into an executive dashboard with clear HR KPIs and decision-ready insights.
The analysis shows:
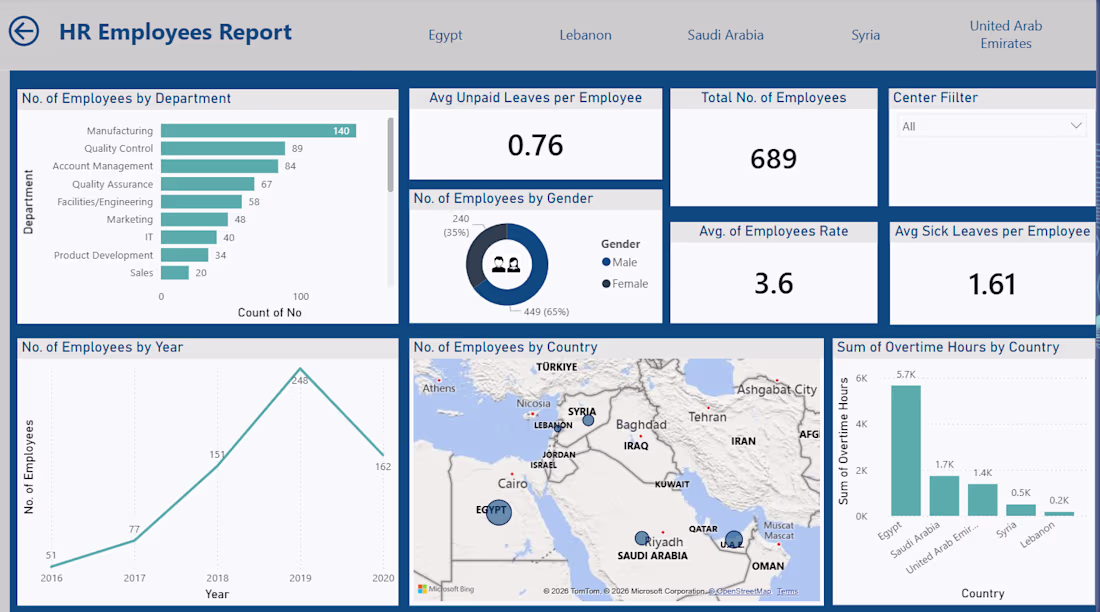
A workforce of 689 employees across 20 departments and 5 countries.
Manufacturing is the largest department, while Egypt has the largest employee base.
Employee growth peaked in 2019, with the largest year-over-year workforce increase.
Average salary is 24.8K annually, with visible variation across departments and countries.
Average sick leave is 1.61 days per employee, and the relationship between overtime and sick leave is essentially negligible in this dataset.
Business Problem
The HR team lacked a centralized view of workforce metrics, which made it difficult to monitor employee trends, compare departments, and support strategic decisions around staffing, compensation, and workload planning.
Project Objectives
Monitor workforce KPIs in one place.
Analyze employee distribution by department, country, and gender.
Track salary and leave patterns.
Identify workforce trends over time.
Highlight areas that require management attention.
Dataset Snapshot
Rows: 689 employees
Columns: 15
Missing values: 0
Duplicate rows: 0
Time span: 2016 to 2020
Countries: Egypt, United Arab Emirates, Saudi Arabia, Syria, Lebanon
Departments: 20
KPI Summary
Total employees: 689
Average performance rating: 3.6
Average sick leaves per employee: 1.61
Average unpaid leaves per employee: 0.76
Average overtime hours per employee: 13.70
Total annual salary: 17.10M
Average annual salary: 24.8K
Key Insights
Manufacturing leads headcount
Manufacturing has the largest workforce with 140 employees.
This makes it the most important area for staffing, scheduling, and operational planning.
Egypt dominates workforce concentration
Egypt has 379 employees, the highest count among all countries.
That concentration should be considered when interpreting country-level salary and overtime patterns.
Workforce growth peaked in 2019
Headcount rose from 51 in 2016 to 248 in 2019, then declined to 162 in 2020.
This pattern suggests either a hiring slowdown, restructuring, or a change in staffing strategy after the 2019 peak.
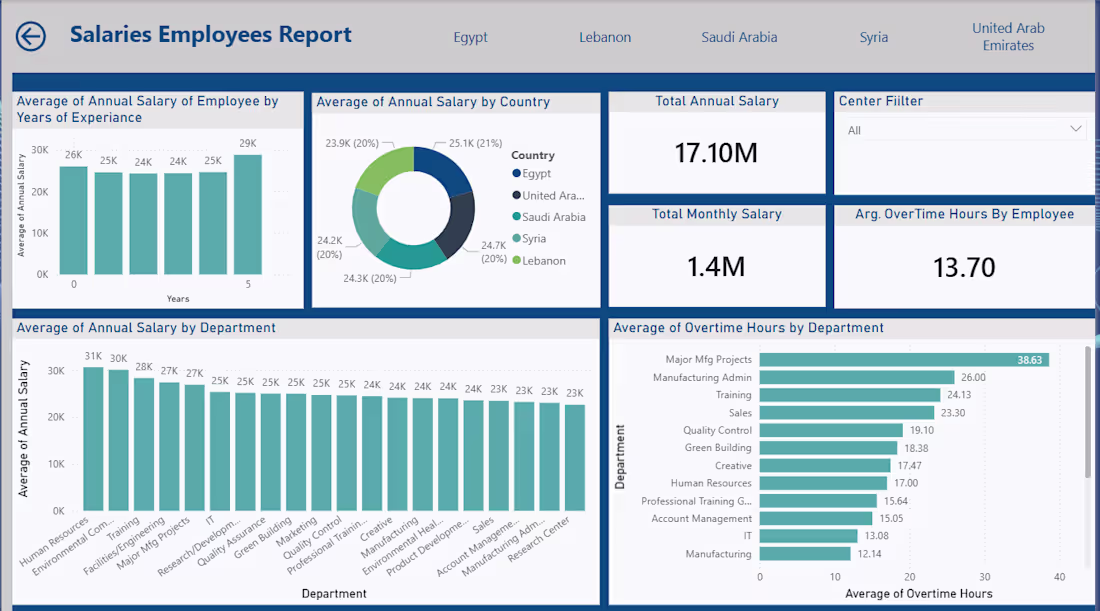
Compensation varies materially by department
Highest average annual salary: Human Resources at about 30.7K
Lowest average annual salary: Research Center at about 22.6K
This gap is meaningful and worth reviewing for internal equity and role alignment.
Overtime and sick leave are not meaningfully linked here
The correlation between overtime hours and sick leaves is approximately -0.03.
In this dataset, overtime does not appear to explain sick leave behavior.
2020 employees show the highest average salary
Employees who started in 2020 have the highest average annual salary in the dataset.
That may indicate a changed hiring mix, revised pay structure, or both.
Recommended Actions
Review salary bands by department to check for consistency and internal equity.
Investigate the 2019 to 2020 workforce drop to understand whether it was driven by attrition, restructuring, or hiring policy changes.
Segment leave analysis by department and country to identify localized absenteeism patterns.
Add turnover, tenure, and promotion data in a future version to make the dashboard more strategic.
Convert the current descriptive dashboard into a more diagnostic HR performance model with drill-through pages and trend comparisons.
Dashboard Pages
Business Problem - explains the context and challenges.
Business Requirements - documents the questions the dashboard is designed to answer.
HR Employees Report - headcount, gender, country, leave, overtime, and growth analysis.
Salaries Employees Report - salary distribution by year of experience, country, department, and overtime.
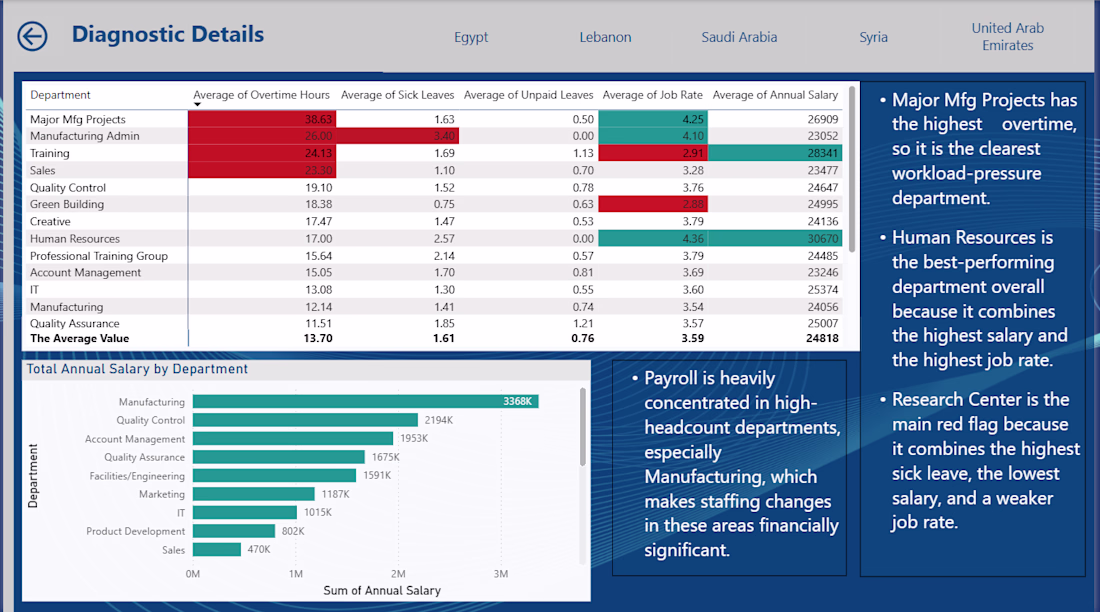
Diagnostic Details - highlights workload pressure, leave patterns, performance alignment, and payroll concentration by department.
Summary Report - executive-level narrative summary of the main findings.
Tools Used
Power BI
Power Query
DAX
Limitations
The dataset is a snapshot, so it does not include turnover, exit reasons, or promotion history.
Correlations shown in the dashboard should not be treated as causal relationships.
Country comparisons should be interpreted carefully because the sample is uneven across locations.


The network for creativity
Join 1.25M professional creatives like you
Connect with clients, get discovered, and run your business 100% commission-free
Creatives on Contra have earned over $150M and we are just getting started
Related posts
Did you know a tornado formed the year you were born?
Not a real one. A data one.
Type your birth year. Watch the storm react - the speed, the color, the rage of it - all driven by the exact CO₂ levels recorded that year.
🌪️Live Site - https://thedatatornado.figma.site
💻GitHub Repo - https://github.com/isumenuka/Thedatatornado
🔬 The Problem
Climate change is the most documented crisis in human history. Scientists have been collecting data for over 65 years. But most people feel nothing when they see the numbers - because a wall of data doesn't make you care. That is a design problem. The Data Tornado is my answer.
⚙️ How It Was Built
I started in FigJam - mapping the full app structure, severity color system (Stable → Elevated → Critical → Extreme), and the 65-year climate timeline before touching any build tool.
In Figma Make, I loaded my complete design guidelines first - colors, fonts, spacing rules - so every generated output matched my vision from the first prompt. That one step eliminated hours of corrections.
The MCP connector was the most critical technical piece: a custom live pipeline to NOAA's servers, pulling real CO₂ and temperature readings automatically every time someone opens the app. No downloading. No pasting. Always live.
The hero background video was generated entirely in Figma Weave - I set a start frame and end frame, and Weave generated the full atmospheric storm footage between them. The Figma Agent handled precision edits throughout -clicking directly on individual elements, repositioning buttons, aligning sections, without touching anything else.
Supabase powers the share cards, news gallery, and live data caching. GitHub handles deployment.
🛠️ Tools Used
→ FigJam: full app structure, severity system & data flow diagrams
→ Figma Make: prompt-to-code app with custom NOAA MCP connector
→ Figma MCP: live pipeline direct to NOAA's climate API
→ Figma Weave: AI video generation for the hero storm background
→ Figma Agent: precision element-level UI edits throughout the build
→ Supabase: backend for share cards, news & data caching
→ GitHub: deployment and version control
✨ Key Feature - Birth Year Telemetry
Enter your birth year. The app instantly generates your personal climate log -the exact CO₂ concentration the year you arrived in the world, your temperature anomaly then vs. now, your severity level at birth vs. today. It stops being a global statistic. It becomes yours.
Most people go quiet when they see their own number.
What happened on the day you were born? Share your link in the comments!
THIS IS MINE - https://thedatatornado.figma.site/?share=d9844bb7-12d7-4c5a-94e8-ebd84ade9f8b
Project Details: HR Workforce Analytics Dashboard
This dashboard analyzes key HR metrics such as employee attrition, performance, demographics, and department distribution. It helps identify workforce trends and patterns to support better HR planning and decision-making through clear and interactive visual insights.
HR Employee Analysis Page
This page provides a detailed breakdown of individual employee data within the organization, focusing on key attributes such as performance ratings, job roles, department allocation, tenure, salary distribution, and demographic information. It is designed to help HR teams gain a deeper understanding of workforce composition at the employee level.
Through interactive filters and visual insights, the page makes it easy to identify high-performing employees, detect retention risks, and analyze patterns across different groups. It also supports comparisons between departments and roles to highlight strengths and areas that may need improvement.
Overall, this section turns raw employee-level data into meaningful insights that support better talent management, workforce optimization, and informed HR decision-making.
Challenges
View allTrending
Claude
Claude has entered the design space. How are you using Claude Design?
Contra University
Learn from expert creatives how to earn more using next-gen AI tools.
MagicPath
The canvas is infinite, and exploration is becoming the workflow. How are you using MagicPath?
creativeaiflow
Creative AI workflows are evolving. What tools do you use, and what are their strengths and weaknesses?
freelancerlife
Freelancer life is wins, pivots, and everything in between. What’s yours right now?