The network for creativity
Join 1.25M professional creatives like you
Connect with clients, get discovered, and run your business 100% commission-free
Creatives on Contra have earned over $150M and we are just getting started
Back to feedPost

💡 The most profitable 30 minutes of your month? Running the reports nobody wants to open.
I've managed Amazon stores for over three years. The pattern is always the same: sellers track sales and PPC, but ignore the reports where money quietly leaks.
Here's the 5-point audit I run for every client, every 30 days:
Reimbursement Report – Amazon owes you for lost or damaged inventory. Claim it.
Stranded Inventory – unsellable stock still bills storage fees. Fix or remove it.
FBA Fee Preview – dimension errors overcharge you daily. Correct them.
Return Reasons by SKU – your customers are telling you what to fix. Listen.
Inventory Age Report – old stock drains cash. Cut it loose before it costs more.
Time required: 30 minutes. Tools: just Seller Central.
This routine has recovered anywhere from $200 to $2,000+ in a single sitting. No new products. No extra ads. Just plugging leaks that were already there.
The sellers who build this habit stop bleeding money and start compounding their margins. The ones who skip it stay busy and wonder where their profit went.
Which of these five reports will you check this week? And which one have you been avoiding? Let's talk. 👇
#AmazonFBA #ProfitRecovery #FBAAudit #EcommerceTips #AmazonSeller #BusinessHealth
The network for creativity
Join 1.25M professional creatives like you
Connect with clients, get discovered, and run your business 100% commission-free
Creatives on Contra have earned over $150M and we are just getting started

Challenges
View all


Related posts

Shopify Analytics will happily tell you revenue and ROAS. It will not tell you if you actually made money after COGS, fees, shipping, returns, and ad spend.
That gap is why I built True Profit Analytics under Reiwa Dev.
You set COGS and costs, import ad spend via CSV, then get a Founder view (P&L waterfall, CM1 to CM2 to net) and an Ads Manager view (POAS and campaign spend). Action cards flag the leaks. You can annotate Shopify Analytics events and export CSV when you need to show someone else the numbers.
Lift adds MCP so Claude, ChatGPT, Cursor, and similar tools can query those Founder and Ads dashboards instead of you screenshotting charts into a chat.
I built it because too many Shopify brands I work with celebrate ROAS while the bank account disagrees. If you only look at top-line vanity metrics, you optimise the wrong thing.
Starts at $12.49/month with a trial. If you run paid ads on Shopify and still argue with your own profit numbers, try it and tell me what is missing.

apps.shopify.com
RWA: True Profit Analytics - True profit after COGS, fees & ads - not vanity... | Shopify App Store
Track true net profit and contribution margin after COGS, fees, and ads. Founder & Ads dashboards, CSV exports, and Lift MCP for AI.


SalesTrack: A Modern Sales Tracking and Client Management App
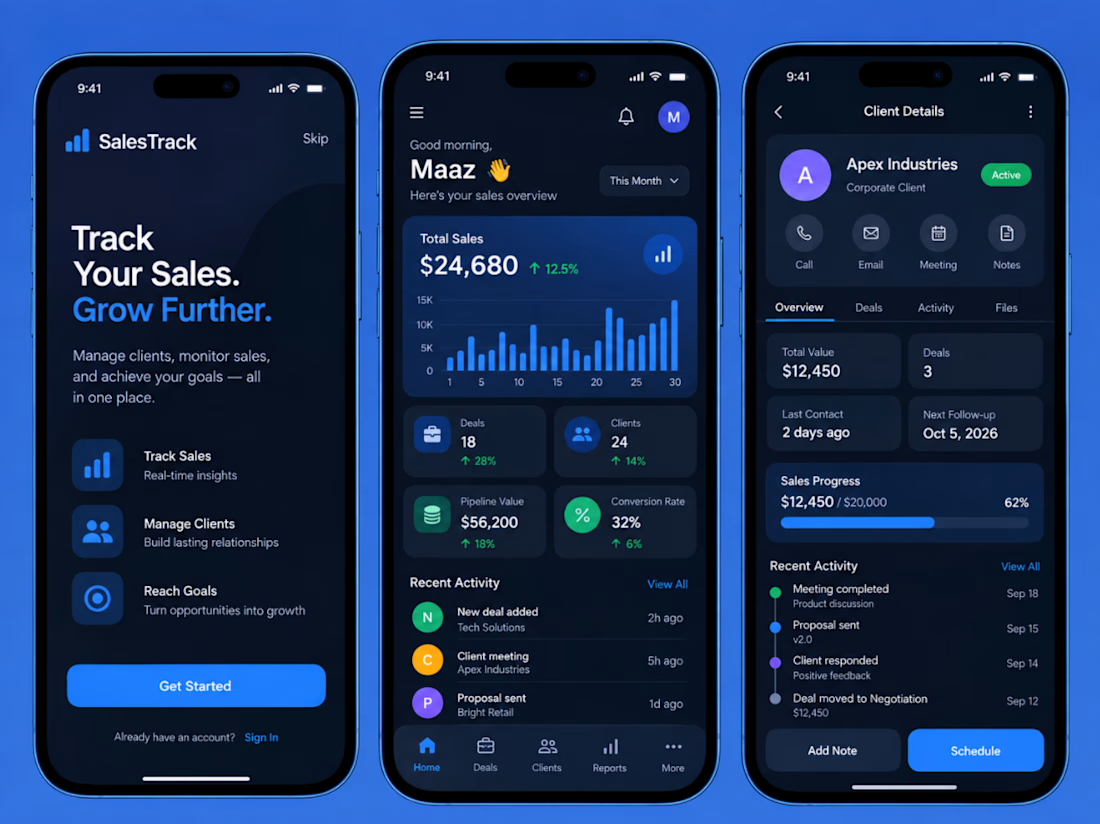
I designed SalesTrack to give sales professionals a clear view of their performance without turning the experience into a spreadsheet on a phone. Instead of overwhelming users with dense CRM tables, long reports, and scattered client records, I structured the product around the questions sales teams check every day: how much have I sold, how healthy is my pipeline, which deals are moving, and which clients need attention next?
The visual identity combines a deep navy interface with electric blue accents, supported by green, purple, and amber indicators for performance states. The dark background keeps the interface focused, while blue is used consistently for primary actions, navigation, charts, progress bars, and active states. Cards are flat, spacious, and highly legible, creating a professional dashboard aesthetic without relying on illustrations or decorative imagery.
The onboarding screen introduces the product with a simple promise: “Track Your Sales. Grow Further.” Instead of explaining every feature through lengthy copy, it highlights the three core functions of the platform: tracking sales, managing clients, and reaching revenue goals. A single Get Started action keeps the entry experience focused and mobile-first.
The main dashboard opens with a personalized greeting and immediately surfaces the most important sales metrics. Total Sales sits at the top of the hierarchy alongside month-over-month growth and a compact performance chart. Supporting KPI cards show Deals, Clients, Pipeline Value, and Conversion Rate, allowing users to understand the state of their business within seconds.
Sales performance is presented visually rather than through lengthy reports. The dashboard combines bar charts, percentage movements, status indicators, and compact cards to show trends at a glance. Metrics such as $24,680 in total sales, 18 active deals, 24 clients, a $56,200 pipeline, and a 32% conversion rate are organized in a consistent grid so users can compare performance without leaving the screen.
The Recent Activity section turns the dashboard into an operational workspace rather than a static analytics page. New deals, client meetings, proposals, and other sales events are shown chronologically with clear timestamps. This gives users a quick understanding of what has happened recently and where follow-up may be required.
The client detail experience is designed as a lightweight CRM. A client such as Apex Industries opens into a dedicated profile containing account status, communication shortcuts, deal information, activity, documents, and follow-up details. Quick actions for calling, emailing, scheduling meetings, and adding notes are positioned near the top so the screen supports action as much as information.
Client performance is summarized through compact metrics including total account value, number of deals, last contact date, and next follow-up. A sales progress module visually compares the current value against the target, while the activity timeline records milestones such as meetings completed, proposals sent, client responses, and negotiation progress.
Rather than forcing users through separate modules for every task, the interface keeps sales context connected. A representative can move from overall revenue performance to a specific account, review the relationship history, add a note, or schedule the next interaction without breaking the workflow.
Across the product, a five-tab bottom navigation structure; Home, Deals, Clients, Reports, and More, keeps the information architecture predictable. Components, spacing, card dimensions, iconography, and typography remain consistent across screens, making the experience feel like one connected mobile product rather than several dashboards placed together.
Frontend
I built the client as a cross-platform mobile application using React Native and TypeScript. React Navigation manages the bottom-tab structure and stack navigation between dashboards, deal records, client profiles, reports, and activity screens.
TanStack Query handles API data fetching, caching, background refreshing, and loading states, while Zustand manages lightweight client-side state such as active date ranges, dashboard filters, selected pipeline stages, and temporary UI preferences.
The dashboard is built from reusable components including Metric Cards, Sales Charts, Pipeline Cards, Activity Rows, Client Cards, Progress Indicators, and Quick Action controls. A centralized design-token system manages spacing, typography, border radii, dark surfaces, and accent colors to maintain visual consistency across every screen.
Chart components use lightweight mobile visualization libraries to display revenue trends, deal progression, conversion rates, and pipeline performance without overcrowding smaller screens. Responsive layouts ensure every dashboard element maintains proper mobile proportions rather than shrinking desktop-style panels into a phone interface.
Backend
The backend is a Node.js REST API built with NestJS and PostgreSQL through Prisma ORM. The primary data model covers Users, Clients, Contacts, Deals, Pipelines, Sales Activities, Notes, Meetings, Tasks, Sales Targets, and Reports.
Each deal stores its value, pipeline stage, probability, assigned salesperson, expected close date, client relationship, status, and activity history. Client records contain contact details, account value, associated deals, last interaction, upcoming follow-ups, notes, and relationship status.
Sales calculations are generated from transactional deal data rather than manually stored dashboard totals. This allows metrics such as total sales, pipeline value, conversion rate, closed deals, average deal size, and target achievement to update automatically as opportunities progress through the pipeline.
Endpoints support dashboard analytics, client search, deal filtering, pipeline management, activity logging, follow-up scheduling, and reporting. For example, dashboard requests can be filtered by salesperson, period, team, or deal stage so the same architecture can support both individual representatives and sales managers.
Authentication uses JWT access and refresh tokens with role-based permissions for sales representatives, managers, and administrators. PostgreSQL stores transactional CRM data, Redis can be used for frequently accessed dashboard aggregates, and WebSockets can optionally provide live updates when deals, activities, or team metrics change.
The result is a mobile-first sales management experience that combines CRM functionality with meaningful sales analytics. SalesTrack gives users a fast, visually clear way to understand performance, manage clients, track opportunities, and decide what action needs to happen next — without the complexity normally associated with traditional CRM platforms.