The network for creativity
Join 1.25M professional creatives like you
Connect with clients, get discovered, and run your business 100% commission-free
Creatives on Contra have earned over $150M and we are just getting started
Back to feedPost

Retail Inventory Sales Analysis
Retailers often collect large amounts of sales and inventory data but struggle to turn it into clear decisions around stock, demand, and revenue performance.
I built an end-to-end retail analytics solution using Python, MySQL, and Power BI. With Python and Pandas, I cleaned and prepared the raw dataset, handling missing values based on their business meaning rather than blindly replacing them. The data was then analyzed in MySQL to explore revenue, units sold, inventory, discounts, categories, regions, and seasonal performance.
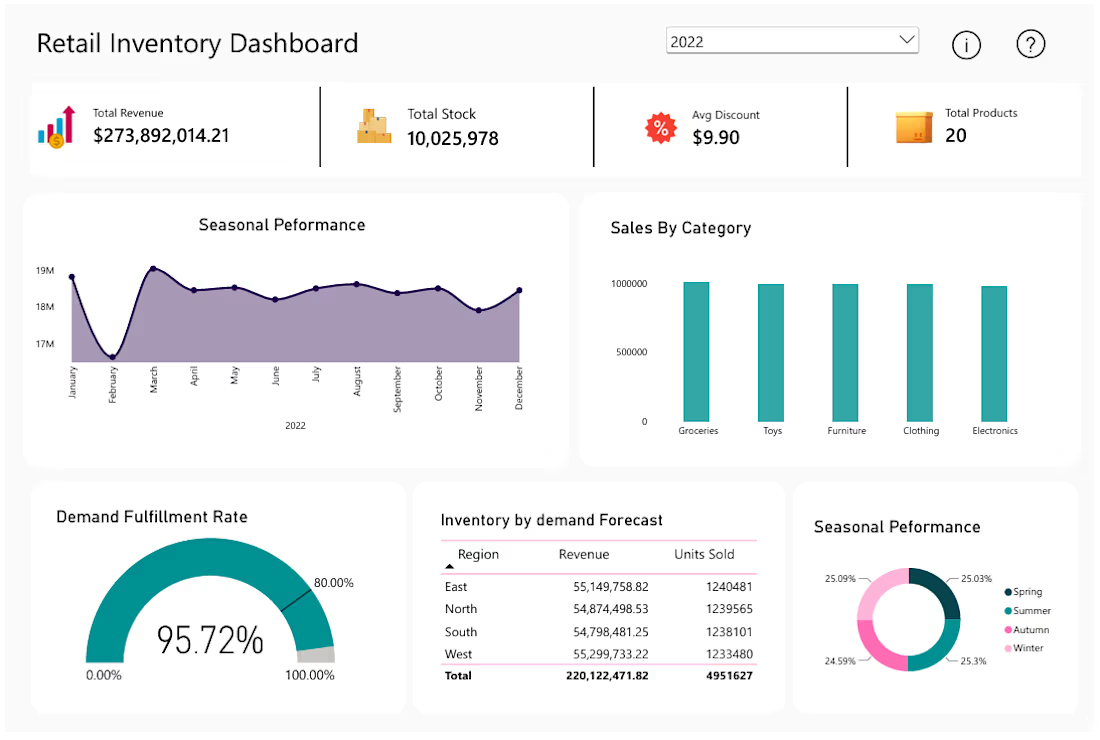
The final result was an interactive Power BI dashboard designed for quick business monitoring. It includes KPI cards for revenue, total stock, demand fulfillment, total products, and average discount, alongside sales by category, monthly seasonal performance, regional revenue and units sold, inventory by demand forecast, and seasonal distribution.
Key findings included a 95.72% demand fulfillment rate, balanced sales across the five product categories, and a near-even distribution of performance across the four seasons. The dashboard also provides a clear view of regional sales and inventory relationships, helping identify where demand and stock performance may require further attention.
Tools: Python (Pandas) · MySQL · Power BI · DAX


The network for creativity
Join 1.25M professional creatives like you
Connect with clients, get discovered, and run your business 100% commission-free
Creatives on Contra have earned over $150M and we are just getting started







Related posts

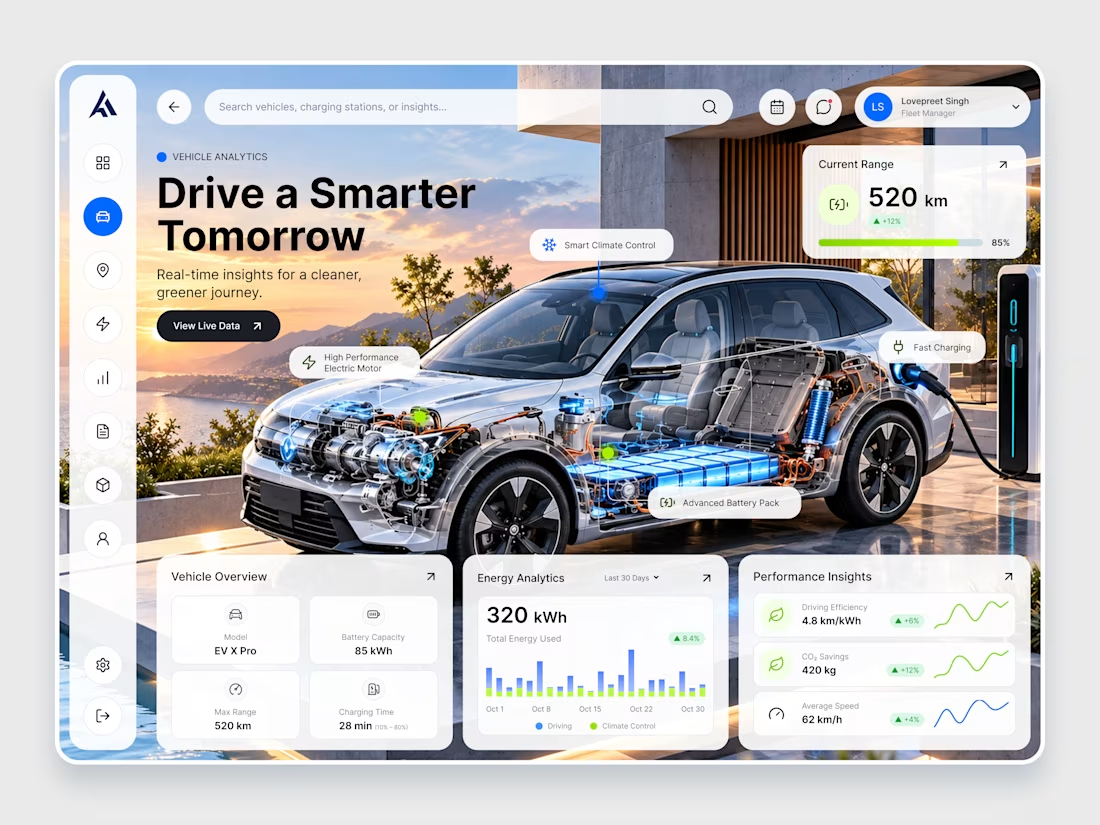
EV X Pro — Futuristic EV Analytics & Dashboard Design
Introducing EV X Pro, a futuristic electric vehicle analytics dashboard designed to make every journey smarter, cleaner, and more efficient. ⚡
Featuring a premium automotive visual, real-time battery insights, energy consumption analytics, charging performance, driving efficiency metrics, and an intuitive dashboard interface, this concept combines modern UI/UX design with next-generation electric mobility.
Designed with a clean glassmorphism aesthetic, vibrant blue accents, and minimal data visualizations, EV X Pro delivers a seamless experience for monitoring vehicle performance and sustainable driving.



That's really unique & futuristic dashboard 🔥🔥🔥🔥🔥

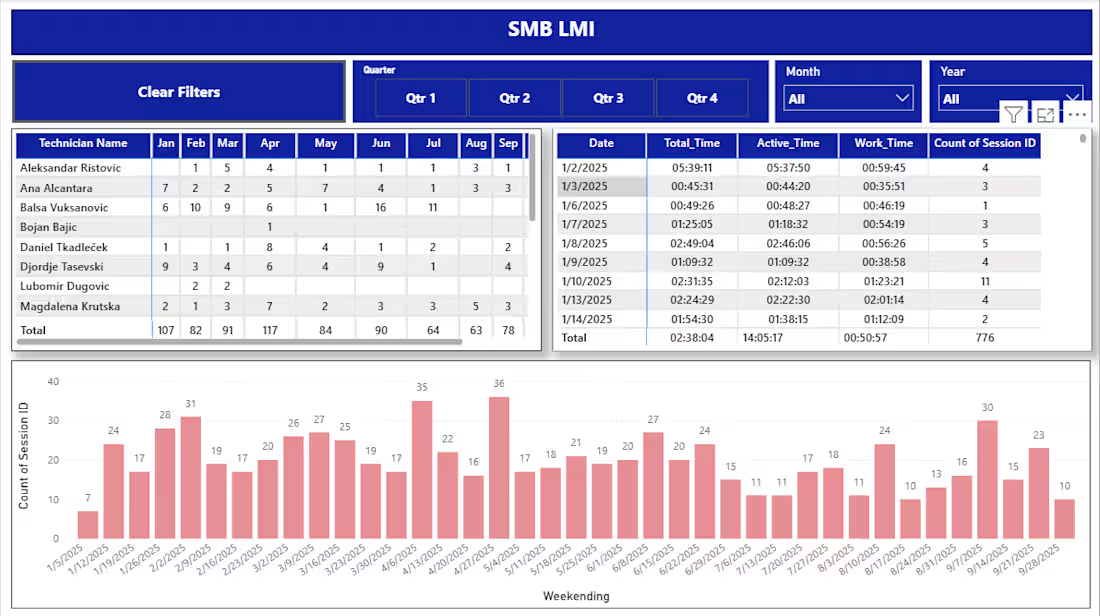
Developed an interactive Power BI SMB Business Care Dashboard to monitor customer support operations across Email, Cases, Voice, Chat, and LMI channels. Built dedicated report pages with interactive filters and data visualizations to track agent performance, analyze service activity, and provide actionable insights for operational decision-making.

In a world that’s always rushing, maybe moving forward doesn’t mean moving faster.
This self-initiated campaign concept for Studio Helpers explores deliberate living through bold experimental typography, electric chartreuse, and motion-inspired echoes that come to a sudden stop.
The idea is simple: "You don’t have to rush to move forward."



The sudden stop in the motion design effectively mirrors the psychological shift from frantic multitasking to focused execution. It visually reinforces that pausing to breathe is a strategic move, not a failure of momentum.