The network for creativity
Join 1.25M professional creatives like you
Connect with clients, get discovered, and run your business 100% commission-free
Creatives on Contra have earned over $150M and we are just getting started
Back to feedPost

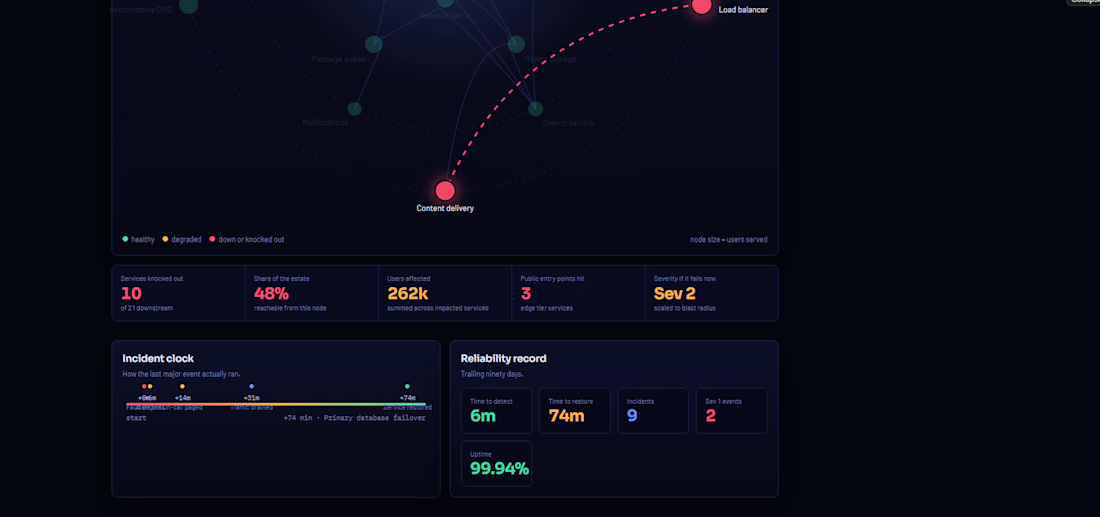
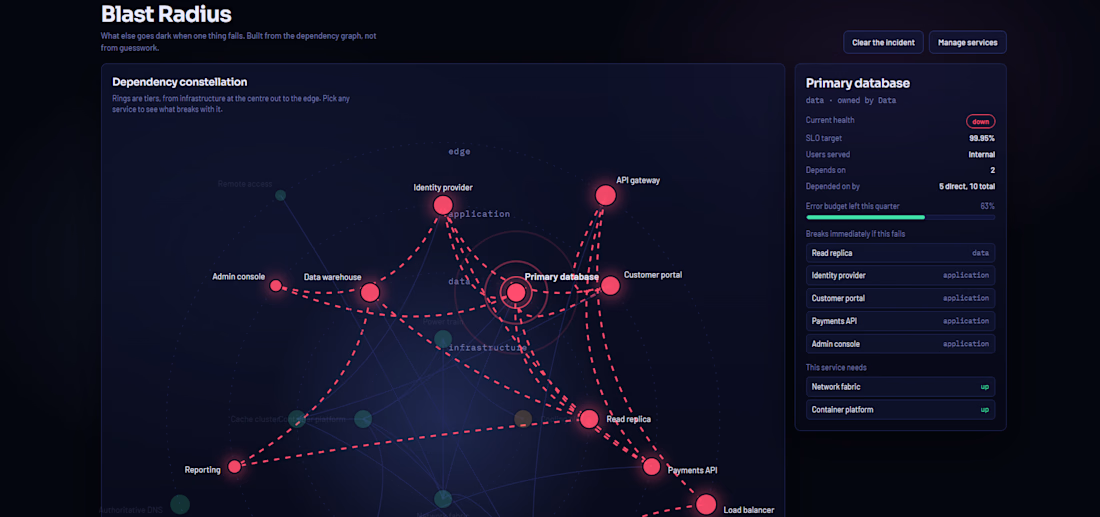
Interactive service dependency dashboard that visualizes the blast radius of infrastructure failures. Explore service relationships, impacted users, severity, incident timelines, reliability metrics, and live health states through an animated radial dependency map.

The network for creativity
Join 1.25M professional creatives like you
Connect with clients, get discovered, and run your business 100% commission-free
Creatives on Contra have earned over $150M and we are just getting started

Challenges
View all


Related posts

I desired to learn Framer deeply, with infusion of AI and this is my first live Project.
MacBook inspired Retro Portfolio Piece.


Congrats on your first live Framer project! Fun concept to explore.


I’ve been razzmatazzing and flibbertigibbeting with Claude Code and somehow ended up with a new yels.dev.
It finally feels like me: simple on the surface, slightly complicated underneath, and very much alive.
You can see who I am, what I do, the work behind Herodot, RaptorLabs, CyberLink Security and Solmint, plus a selection of projects I’ve built across AI, cybersecurity, Web3, product systems, education, archives, and experimental digital spaces.
Built to be explored


The simple-on-the-surface, layered-underneath idea comes through so clearly in the presentation. I especially like how the project archive turns the site into something to explore rather than just a résumé of links.

Built this over a weekend as an experiment with AI-assisted design and development.
Duo Case is an absurd concept for turning two iPhones into a very unofficial foldable iPhone. The goal was to see how far AI could accelerate the process while keeping creative direction, design decisions and final execution in human hands.


A weekend build that looks this polished is wild. Where did AI actually save you the most time here, the concepting or the production grind?