The network for creativity
Join 1.25M professional creatives like you
Connect with clients, get discovered, and run your business 100% commission-free
Creatives on Contra have earned over $150M and we are just getting started
Back to feedPost

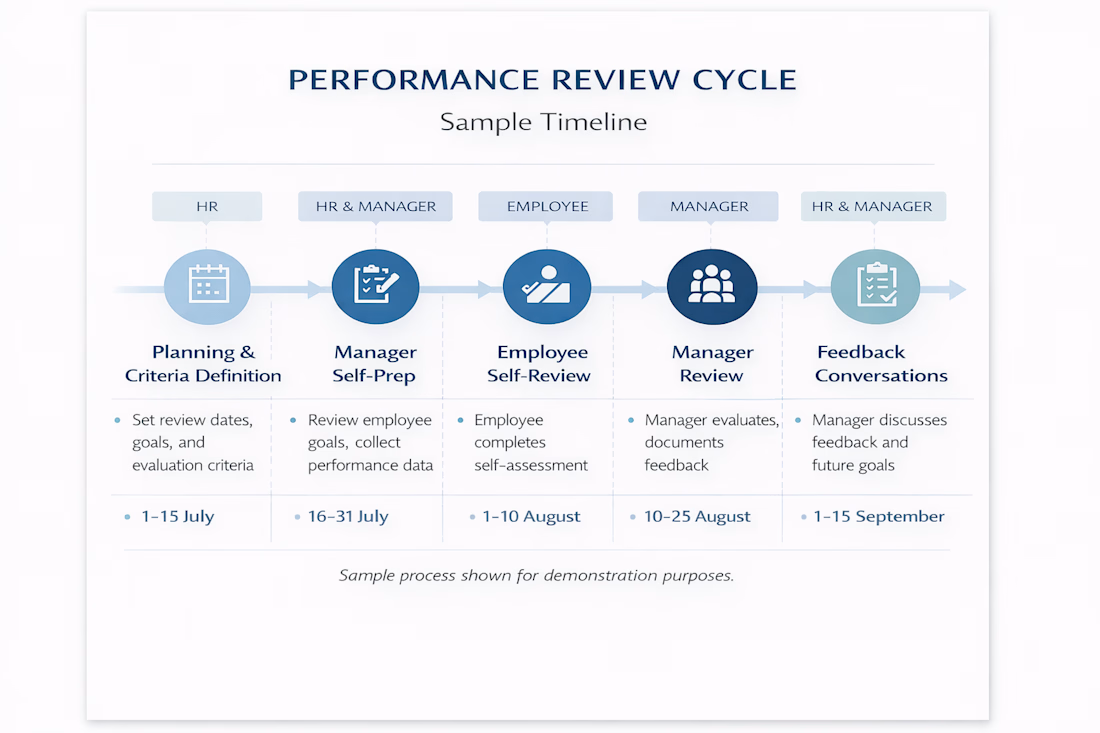
This sample outlines a structured performance review cycle designed to support consistency, fairness, and clear communication. The timeline highlights key stages, ownership, and decision points across managers, employees, and HR.
I design review cycles like this to reduce confusion, support meaningful feedback, and ensure performance processes are practical and repeatable.



Love how this breaks a complex review process into a clear, repeatable framework. Excel is underrated for structured systems like this 👍
The network for creativity
Join 1.25M professional creatives like you
Connect with clients, get discovered, and run your business 100% commission-free
Creatives on Contra have earned over $150M and we are just getting started





Related posts

Dream Motoring World asked me to prepare their VAT return. On review, I started with a bank reconciliation and found several transactions without supporting documents. I requested those documents for input VAT and included them in the VAT working, which helped the client save almost £1,500 of VAT liability.


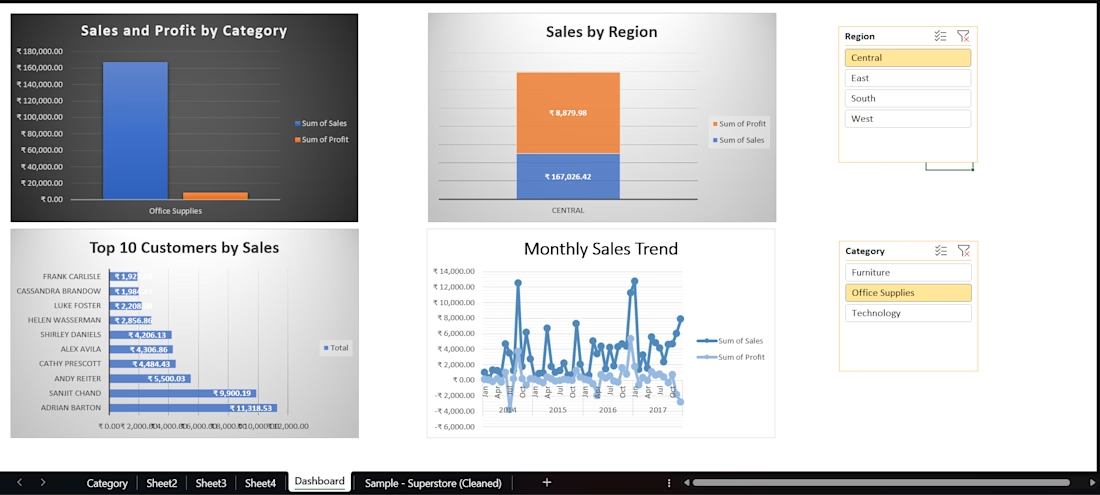
Created an interactive Excel sales dashboard using cleaned Superstore data. Used PivotTables, charts, slicers, and data analysis to track sales, profit, regional performance, top customers, and monthly trends.


Overview
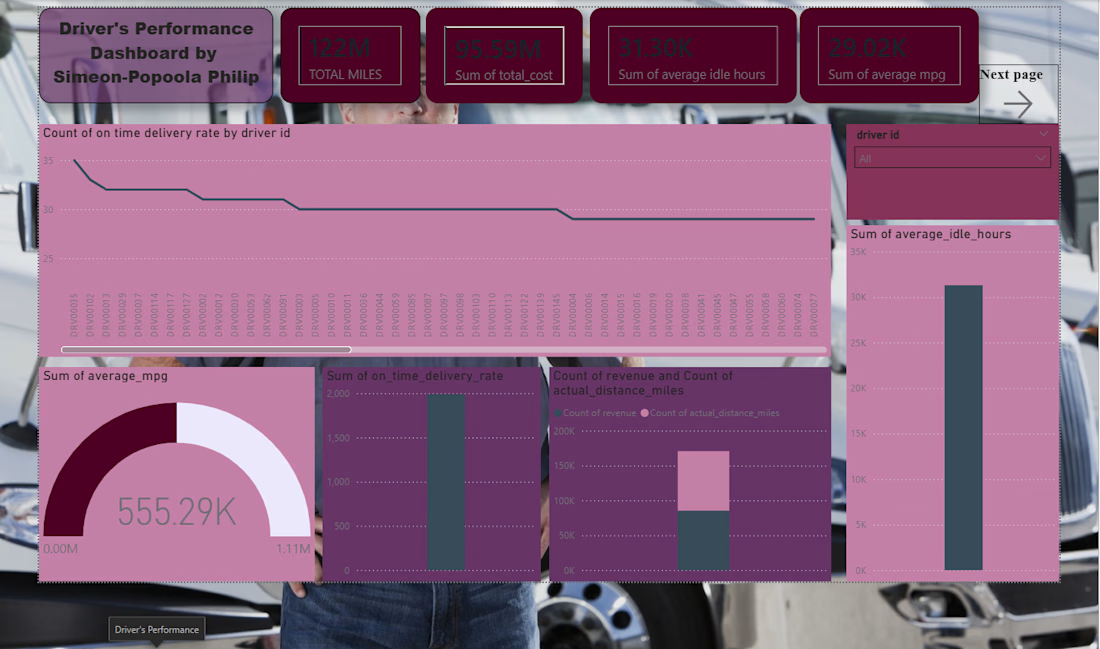
This interactive dashboard provides comprehensive insights into driver performance metrics, enabling fleet managers and logistics teams to monitor, analyze, and optimize driver operations effectively.
Features
Key Performance Indicators (KPIs)
TOTMILES - Total miles driven and total operational cost summary
TOTMINS - Average idle hours and average MPG metrics
TOTOK - Average MPG performance tracking
Data Visualizations
On-Time Delivery Rate by Driver ID
Bar chart visualization showing delivery performance distribution
Enables easy identification of top-performing and underperforming drivers
Revenue vs. Actual Distance Miles
Comparative analysis of revenue generation against actual distance covered
Helps assess driver efficiency and profitability
Driver Performance Metrics
Comprehensive view of on-time delivery rates
Average MPG performance tracking
Technical Specifications
Platform: Data visualization dashboard
Key Metrics Tracked:
Total miles
Operational costs
Idle hours
Fuel efficiency (MPG)
On-time delivery rates
Revenue generation