The network for creativity
Join 1.25M professional creatives like you
Connect with clients, get discovered, and run your business 100% commission-free
Creatives on Contra have earned over $150M and we are just getting started
Back to feedPost

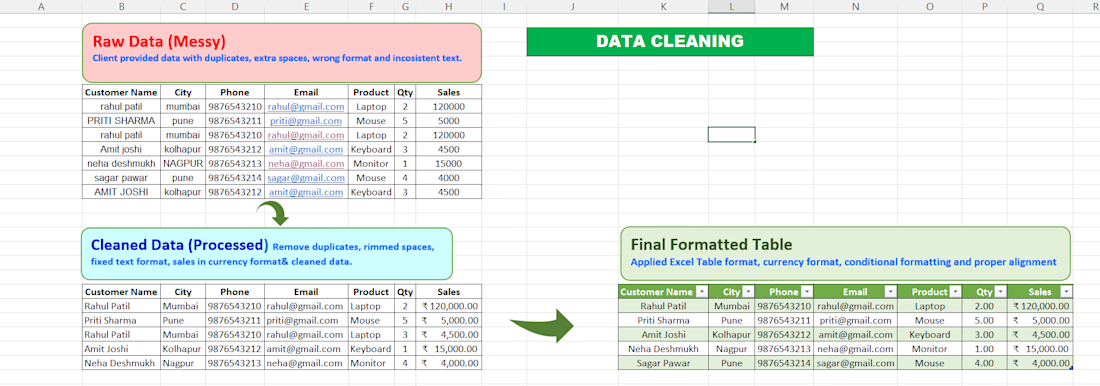
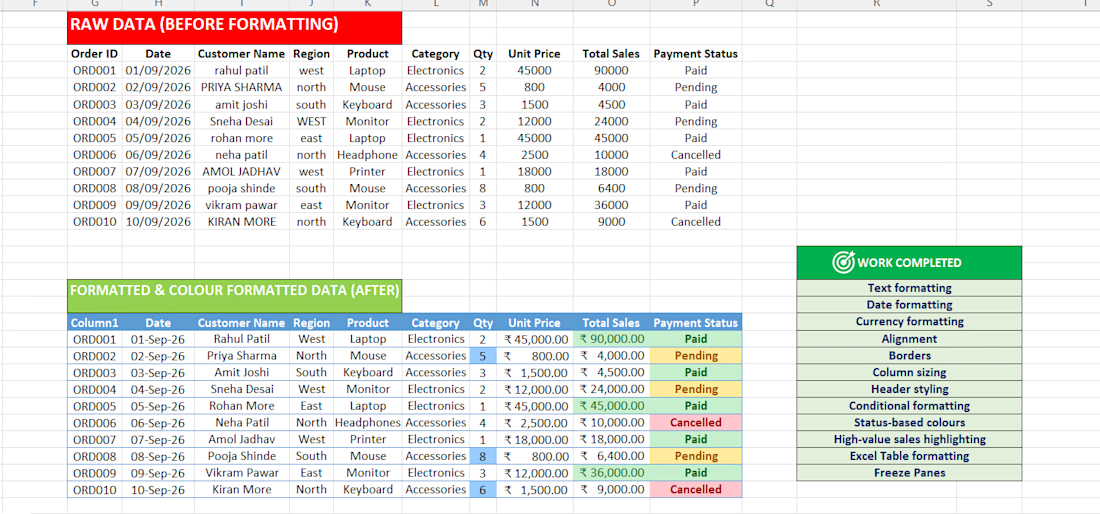
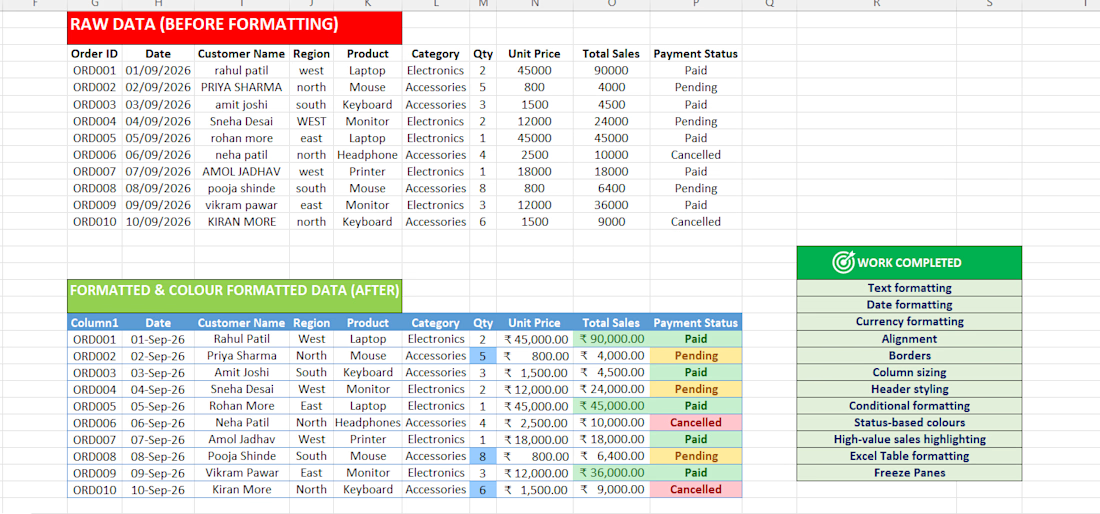
Cleaned and organized raw Excel data by removing duplicate records, trimming extra spaces, standardizing customer names, cities and text formats, correcting data inconsistencies, and applying proper number and currency formatting. Created a clean, structured and professional Excel table ready for analysis and reporting.

The network for creativity
Join 1.25M professional creatives like you
Connect with clients, get discovered, and run your business 100% commission-free
Creatives on Contra have earned over $150M and we are just getting started





Related posts

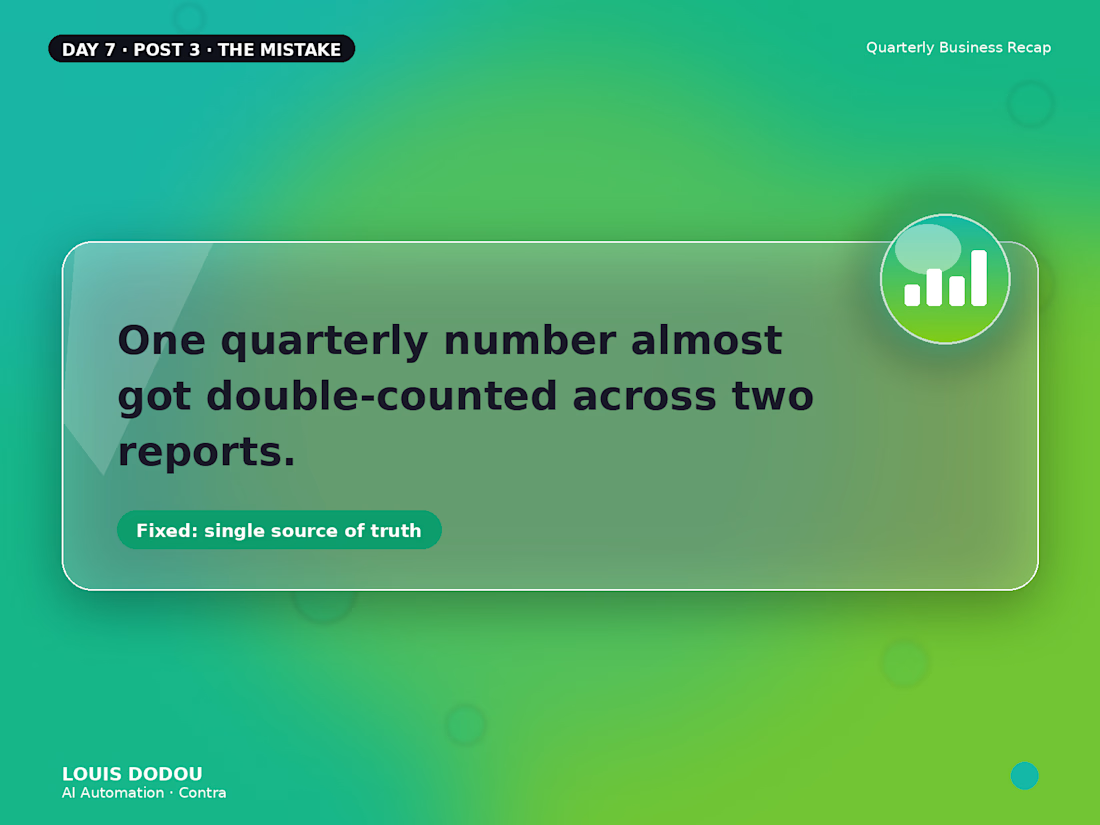
One quarterly number almost got double-counted across two reports.
Two dashboards were quietly tracking overlapping data. Caught before it went out now there's one source of truth the reports pull from, not two that can disagree.
→ A good number is only as good as the one place it actually comes from



Great catch before it shipped. I like the “one source of truth” framing - pulling reports from one validated source makes it much harder for a duplicate dashboard to quietly skew the number again.

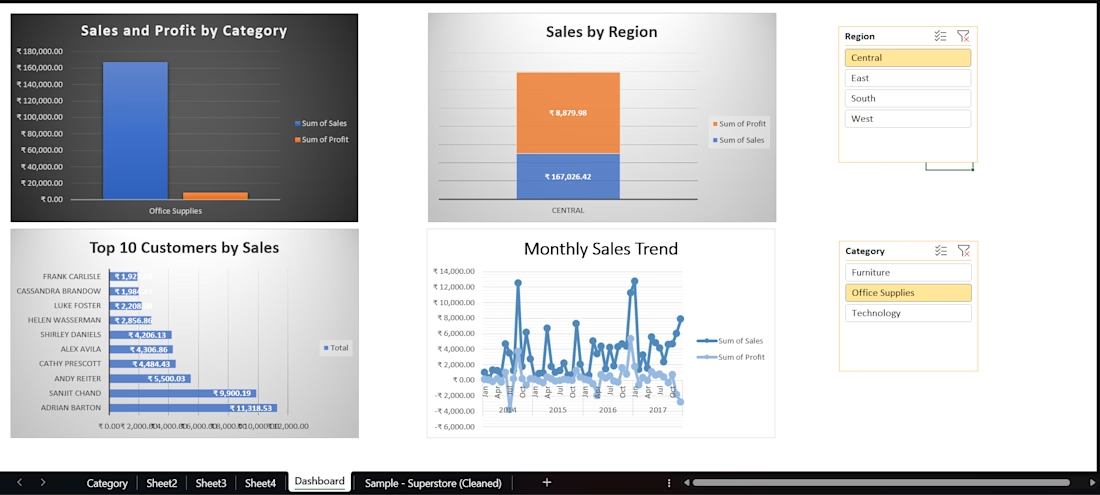
Created an interactive Excel sales dashboard using cleaned Superstore data. Used PivotTables, charts, slicers, and data analysis to track sales, profit, regional performance, top customers, and monthly trends.