The network for creativity
Join 1.25M professional creatives like you
Connect with clients, get discovered, and run your business 100% commission-free
Creatives on Contra have earned over $150M and we are just getting started
Back to feedPost

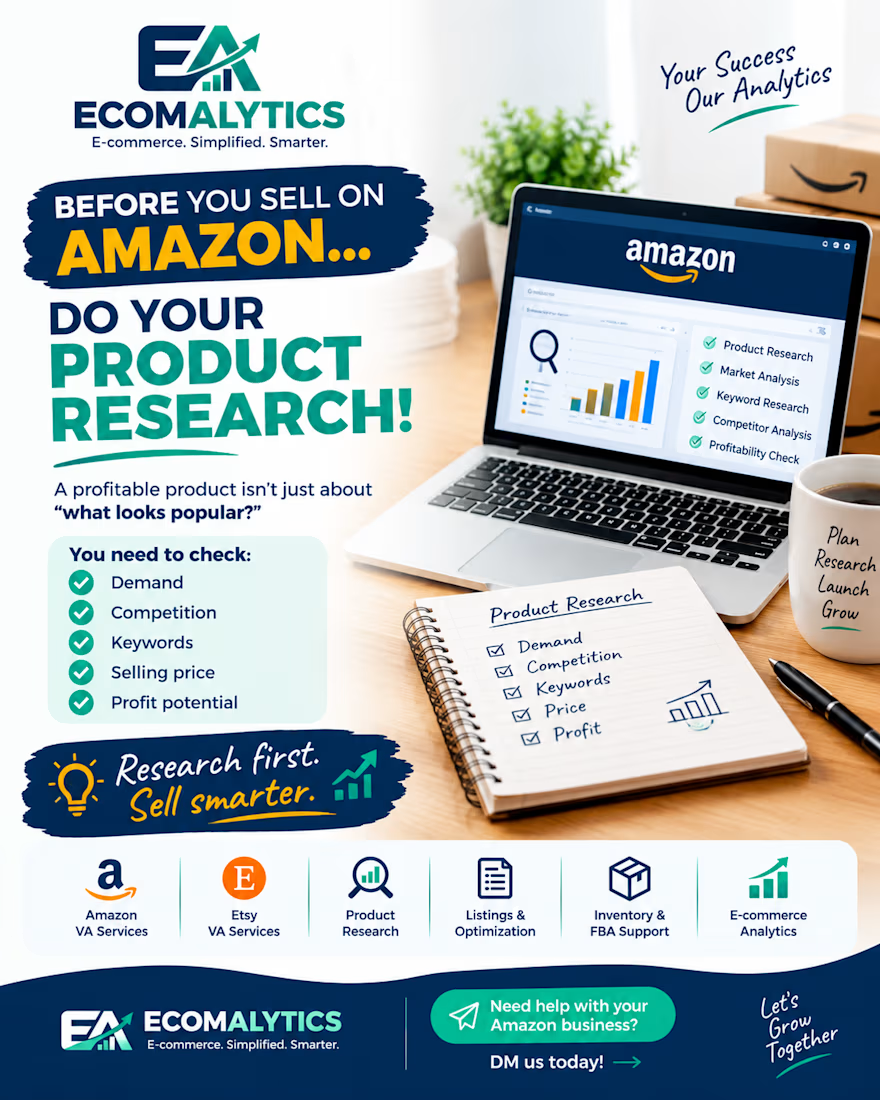
🔎 Before You Sell on Amazon, Do Your Product Research!
Choosing a product because it “looks popular” isn't enough.
A smart Amazon seller should research:
✅ Product demand
✅ Competition
✅ Keywords
✅ Selling price
✅ Profit potential
Good Amazon product research helps sellers make informed decisions before investing money into inventory.
At Ecomalytics, we provide Amazon Virtual Assistant services, including product research, listing optimization, FBA support, inventory assistance and e-commerce analytics.
📩 Need help with your Amazon business? DM Ecomalytics today.
Research first. Sell smarter. 📈
Amazon product research • Amazon VA services • Amazon virtual assistant • Amazon FBA support • ecommerce virtual assistant • product research services
Hashtags
#AmazonProductResearch #AmazonVA #AmazonVirtualAssistant #AmazonFBA #AmazonSeller #AmazonBusiness #ProductResearch #EcommerceVA #EcommerceBusiness #FBA #EcommerceServices #Ecomalytics

The network for creativity
Join 1.25M professional creatives like you
Connect with clients, get discovered, and run your business 100% commission-free
Creatives on Contra have earned over $150M and we are just getting started





Related posts


Your product page shouldn’t make customers work this hard to buy.
For pet apparel, one of the biggest conversion killers isn’t always the product.
It’s uncertainty about fit.
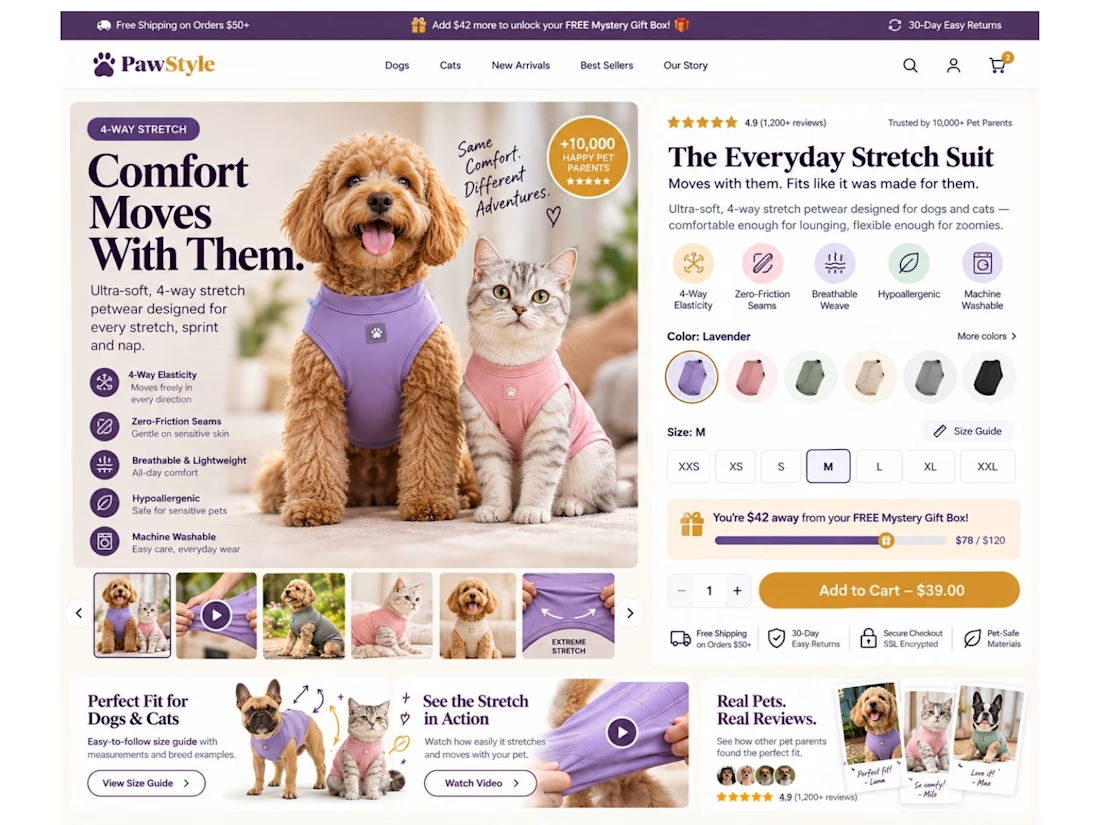
So I designed this Shopify product page concept around one goal: remove hesitation before the Add to Cart.
Instead of a basic product page, I built the buying experience around:
🐾 Dog + cat sizing support
📏 Easy-access interactive size guide
🧵 4-way stretch & product benefit callouts
🎥 Stretch demonstration video
⭐ Pet-specific reviews & UGC
🎁 Free gift progress tracker to increase AOV
🎨 Color + size selection above the fold
🛒 Clear, high-visibility Add to Cart
📱 Mobile-first sticky purchase experience
📩 Back-in-stock flow for unavailable sizes
The idea is simple:
Don’t just show the product. Answer the questions stopping someone from buying it.
“Will it fit my dog?”
“Will it stretch?”
“Which size should I choose?”
“Can I trust the quality?”
“What are other pet owners saying?”
Good eCommerce design should answer those questions before the customer has to ask them.
That’s how I approach Shopify design: UI/UX + CRO + buyer psychology, not just making pages look good.
What’s the #1 thing that makes you hesitate before buying clothing online—for yourself or your pet? 👇



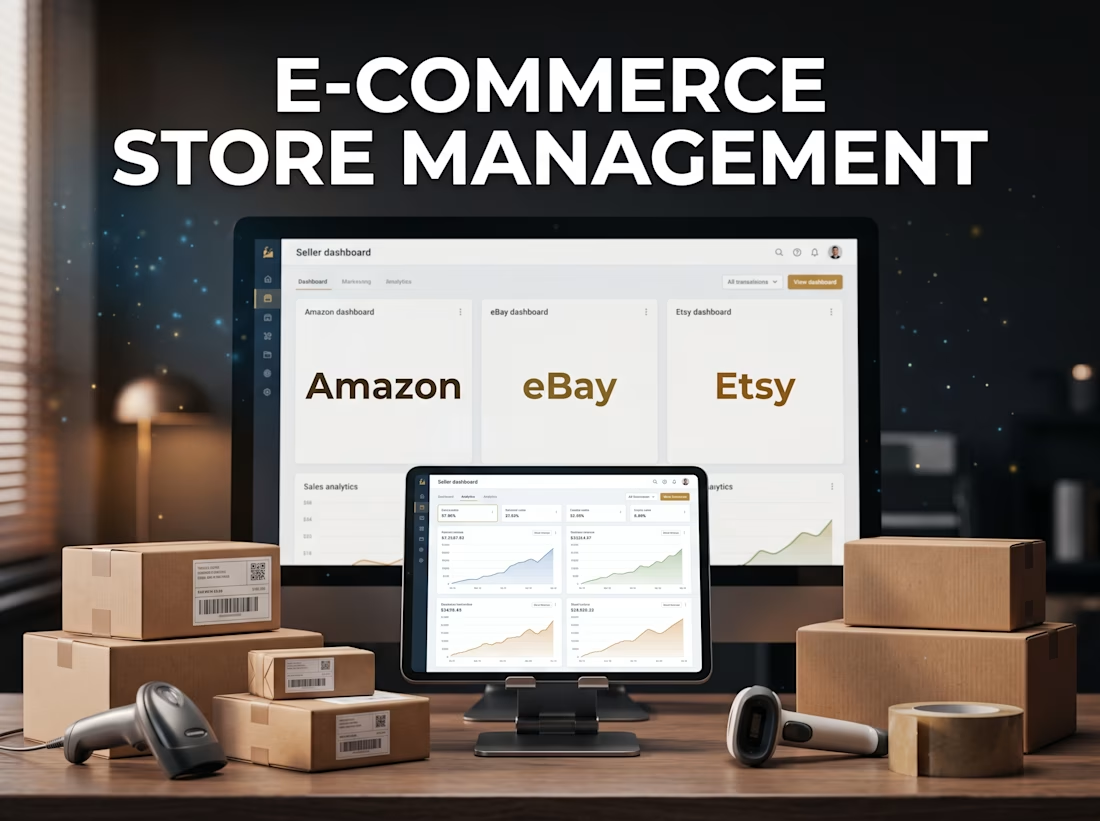
Scaling multi-channel brands across Amazon, eBay, and Etsy takes disciplined operations: data-driven product hunting, direct supplier negotiation, and ruthless PPC bid management.
Currently opening slots for full-service store management, listing optimization, and advertising scale.
Check out the live services on my profile or send a DM to discuss your store metrics!



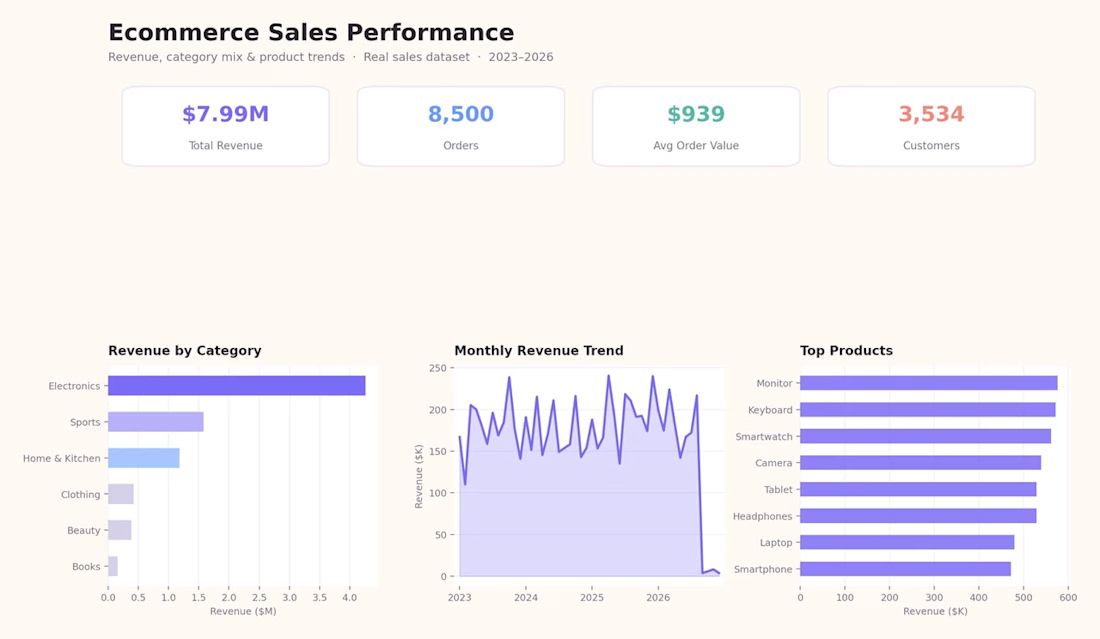
Project Title:
E-Commerce Sales Performance Dashboard
Overview:
An interactive e-commerce analytics dashboard designed to analyze total revenue metrics, customer acquisition, and multi-category product performance. This dashboard aggregates high-volume transaction data to highlight sales trends, top-selling inventory, and average order values for retail growth optimization.
Key Features & Metrics Tracked:
Core KPI Header: Top-level summary tiles displaying Total Revenue ($7.99M), Total Orders (8,500), Average Order Value ($939), and Total Unique Customers (3,534).
Revenue by Category: Horizontal bar chart illustrating revenue distribution across distinct product lines.
Monthly Revenue Trend: Line chart tracking revenue fluctuations and seasonality patterns over multi-year operational cycles.
Top Products Ranking: Ranking visual highlighting best-selling individual items by total sales volume.
Tools & Skills Used:
Microsoft Excel, Data Analytics, Dashboard UI Design, Data Visualization, E-commerce Reporting, KPI Analysis. 🚀